

Multivariate statistical mapping of spectroscopic imaging data
- PMID: 19953514
- PMCID: PMC2849664
- DOI: 10.1002/mrm.22190
Multivariate statistical mapping of spectroscopic imaging data
Abstract
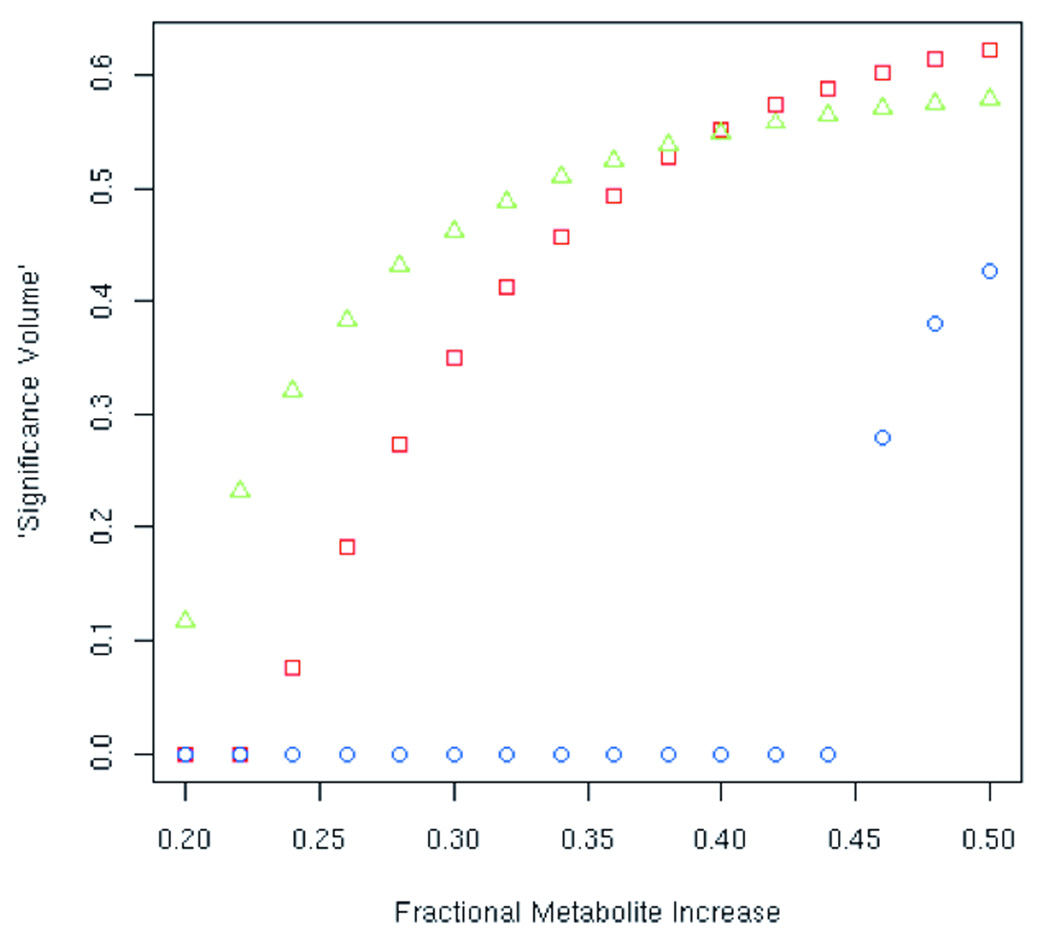
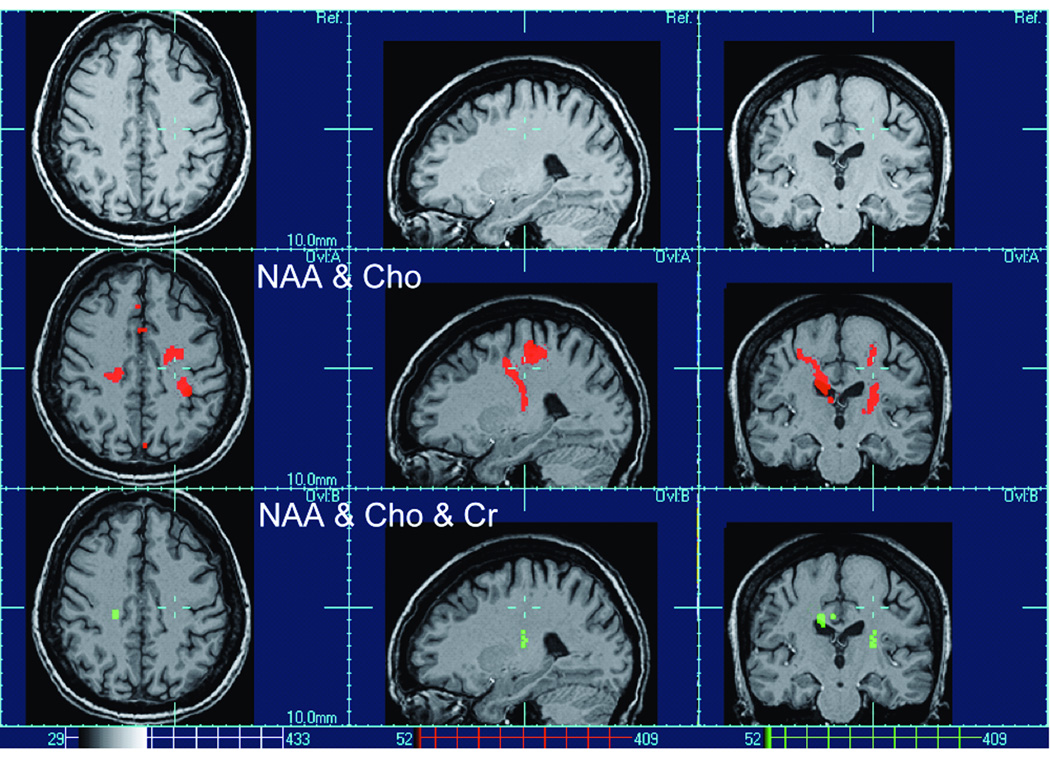
For magnetic resonance spectroscopic imaging studies of the brain, it is important to measure the distribution of metabolites in a regionally unbiased way; that is, without restrictions to a priori defined regions of interest. Since magnetic resonance spectroscopic imaging provides measures of multiple metabolites simultaneously at each voxel, there is furthermore great interest in utilizing the multidimensional nature of magnetic resonance spectroscopic imaging for gains in statistical power. Voxelwise multivariate statistical mapping is expected to address both of these issues, but it has not been previously employed for spectroscopic imaging (SI) studies of brain. The aims of this study were to (1) develop and validate multivariate voxel-based statistical mapping for magnetic resonance spectroscopic imaging and (2) demonstrate that multivariate tests can be more powerful than univariate tests in identifying patterns of altered brain metabolism. Specifically, we compared multivariate to univariate tests in identifying known regional patterns in simulated data and regional patterns of metabolite alterations due to amyotrophic lateral sclerosis, a devastating brain disease of the motor neurons.
Copyright (c) 2009 Wiley-Liss, Inc.
Figures
Similar articles
-
Proton magnetic resonance spectroscopy in patients with early stages of amyotrophic lateral sclerosis.Neuroradiology. 2010 Dec;52(12):1079-85. doi: 10.1007/s00234-010-0685-6. Epub 2010 Apr 6. Neuroradiology. 2010. PMID: 20369234
-
Whole-brain analysis of amyotrophic lateral sclerosis by using echo-planar spectroscopic imaging.Radiology. 2013 Jun;267(3):851-7. doi: 10.1148/radiol.13121148. Epub 2013 Jan 29. Radiology. 2013. PMID: 23360740 Free PMC article.
-
"Absolute" quantification in magnetic resonance spectroscopy: validation of a clinical protocol in multiple sclerosis.Annu Int Conf IEEE Eng Med Biol Soc. 2007;2007:3458-61. doi: 10.1109/IEMBS.2007.4353075. Annu Int Conf IEEE Eng Med Biol Soc. 2007. PMID: 18002741
-
Fast magnetic resonance spectroscopic imaging at 3 Tesla using autocalibrating parallel technique.Conf Proc IEEE Eng Med Biol Soc. 2006;2006:1866-9. doi: 10.1109/IEMBS.2006.260659. Conf Proc IEEE Eng Med Biol Soc. 2006. PMID: 17945677
-
The combined use of conventional MRI and MR spectroscopic imaging increases the diagnostic accuracy in amyotrophic lateral sclerosis.Eur J Radiol. 2015 Jan;84(1):151-157. doi: 10.1016/j.ejrad.2014.10.019. Epub 2014 Nov 13. Eur J Radiol. 2015. PMID: 25466774 Clinical Trial.
Cited by
-
Premotor cortex and frontal eye field region metabolite alteration in human amyotrophic lateral sclerosis patients: A quantitative survey.Neuroradiol J. 2025 May 21:19714009251345102. doi: 10.1177/19714009251345102. Online ahead of print. Neuroradiol J. 2025. PMID: 40395127 Free PMC article.
-
Personalized microstructural evaluation using a Mahalanobis-distance based outlier detection strategy on epilepsy patients' DTI data - Theory, simulations and example cases.PLoS One. 2019 Sep 23;14(9):e0222720. doi: 10.1371/journal.pone.0222720. eCollection 2019. PLoS One. 2019. PMID: 31545838 Free PMC article.
-
PCA- and PLSR-Based Machine Learning Model for Prediction of Urea-N Content in Heterogeneous Soils Using Near-Infrared Spectroscopy.Sensors (Basel). 2025 Jul 4;25(13):4176. doi: 10.3390/s25134176. Sensors (Basel). 2025. PMID: 40648429 Free PMC article.
-
Neuroimaging in amyotrophic lateral sclerosis.Neurotherapeutics. 2011 Jan;8(1):63-71. doi: 10.1007/s13311-010-0011-3. Neurotherapeutics. 2011. PMID: 21274686 Free PMC article. Review.
-
MVComp toolbox: MultiVariate Comparisons of brain MRI features accounting for common information across metrics.bioRxiv [Preprint]. 2024 Feb 28:2024.02.27.582381. doi: 10.1101/2024.02.27.582381. bioRxiv. 2024. PMID: 38463982 Free PMC article. Preprint.
References
-
- Maudsley AA, Darkazanli A, Alger JR, Hall LO, Schuff N, Studholme C, Yu Y, Ebel A, Frew A, Goldgof D, Gu Y, Pagare R, Rousseau F, Sivasankaran K, Soher BJ, Weber P, Young K, Zhu X X. Comprehensive processing, display and analysis for in vivo MR spectroscopic imaging. NMR Biomed. 2006;19:492–503. - PMC - PubMed
-
- Thompson PM, Miller MI, Poldrack RA, Nichols TE, Taylor JE, Worsley KJ, Ratnanather JT. Special Issue on Mathematics in Brain Imaging. NeuroImage. 2009;45:S1–S2. - PubMed
-
- Worsley KJ, Taylor JE, Tomaiuolo F, Lerch J. Unified univariate and multivariate random field theory. NeuroImage. 2004;23 Suppl 1:S189–S195. - PubMed
-
- Thompson PM, Toga AW. Detection, visualization and animation of abnormal anatomic structure with a deformable probabilistic brain atlas based on random vector field transformations. Med Image Anal. 1997;1997(4):271–294. - PubMed
Publication types
MeSH terms
Substances
Grants and funding
LinkOut - more resources
Full Text Sources
Medical
