. 2009 Dec 2:10:572.
doi: 10.1186/1471-2164-10-572.

RNA profiles of rat olfactory epithelia: individual and age related variations

Affiliations

RNA profiles of rat olfactory epithelia: individual and age related variations

Maud Rimbault et al. BMC Genomics. .

Abstract

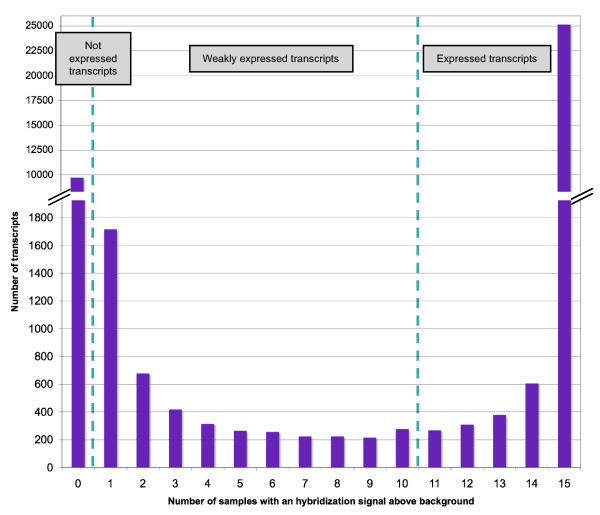
Background: Mammalian genomes contain a large number (approximately 1000) of olfactory receptor (OR) genes, many of which (20 to 50%) are pseudogenes. OR gene transcription is not restricted to the olfactory epithelium, but is found in numerous tissues. Using microarray hybridization and RTqPCR, we analyzed the mRNA profiles of the olfactory epithelium of male and female Brown Norway rats of different origins and ages (newborn, adult and old).

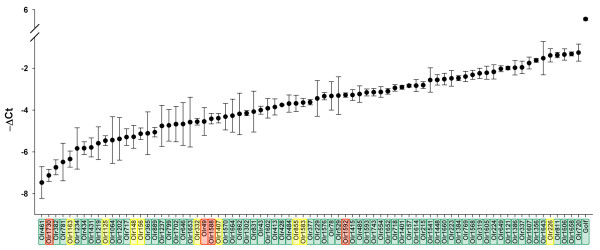
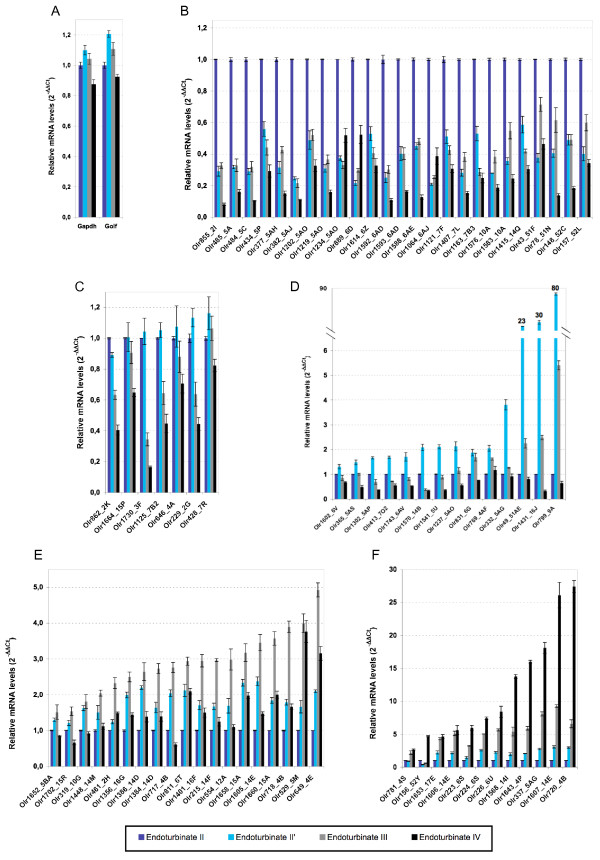
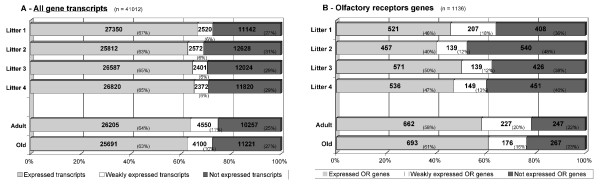
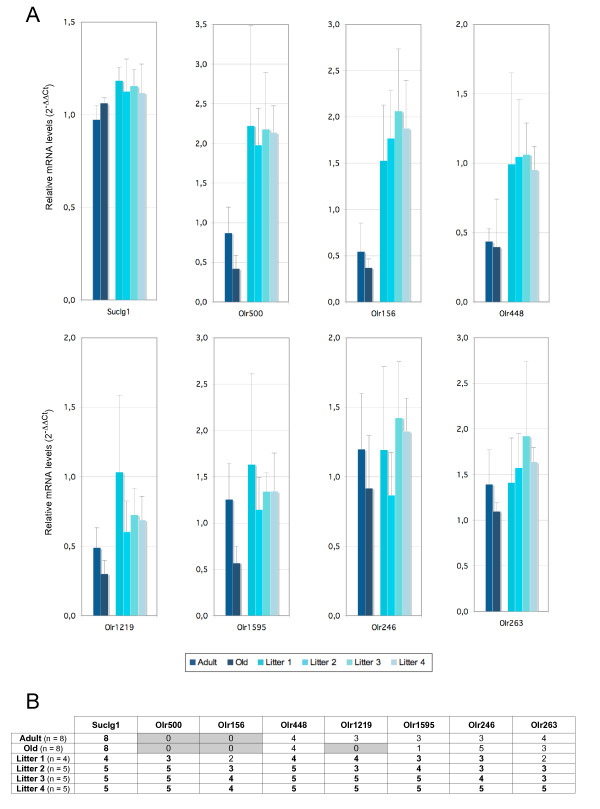
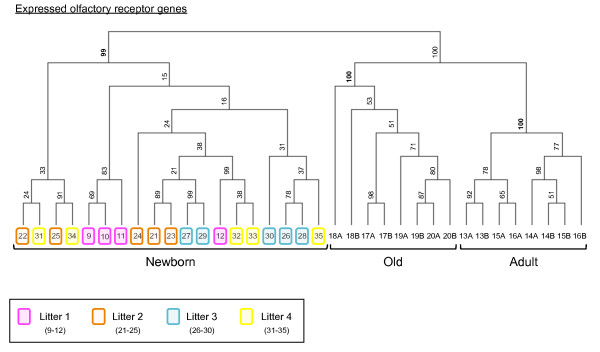
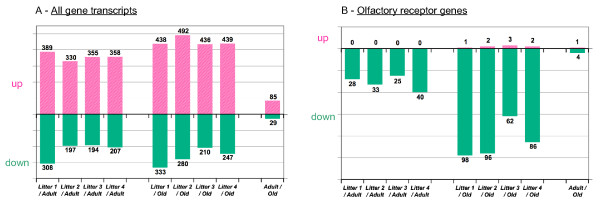
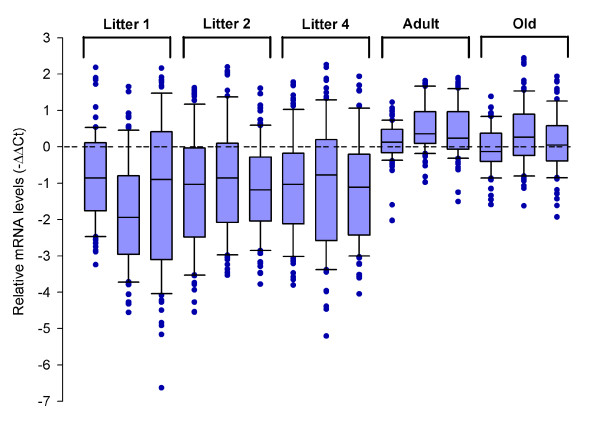
Results: (1) We observed very little difference between males and females and between rats from two different suppliers. (2) Different OR genes were expressed at varying levels, rather than uniformly across the four endoturbinates. (3) A large proportion of the gene transcripts (2/3 of all probes) were detected in all three age groups. Adult and older rats expressed similar numbers of OR genes, both expressing more OR genes than newborns. (4) Comparisons of whole transcriptomes or transcription profiles of expressed OR genes only showed a clear clustering of the samples as a function of age. (5) Most OR genes were expressed at lower levels at birth than in older animals, but a small number of OR genes were expressed specifically or were overexpressed in newborns.

Conclusion: Not all OR genes are expressed at a detectable level. Pups expressed fewer OR genes than adult rats, and generally at a lower level; however, a small subset of OR genes were more strongly expressed in these newborn rats. The reasons for these differences are not understood. However, the specific expression of some OR genes in newborn olfactory epithelia may be related to the blindness and deafness of pups at birth, when these pups are heavily reliant on olfaction and their mother.


Figures

Figure 1
Figure 1
Number of features above background. RNA from 15 olfactory epithelia (eight rats were killed, but one olfactory RNA sample did not pass the quality control test (the RIN test) and was not further processed) were hybridized in parallel. The y-axis represents the number of transcripts plotted against the number of samples (0 to 15) with a hybridization signal above background levels, as defined by GeneSpring. Transcripts for which 11 or more of the 15 samples (73%) gave raw values above background levels were scored as "expressed". Transcripts positive in 1 to 10 samples were scored as "weakly expressed". All other transcripts were scored as "not expressed".
Figure 2
Figure 2
Expression of gene transcripts and OR transcripts. Grouping of total gene transcripts and OR transcripts into three categories: expressed, weakly expressed and not expressed. For 39,308 of the 41,012 unique probes on the array, an accession number is given in GenBank and Ensembl [45]. They correspond to 23,642 unique transcripts or genes, including 1136 OR genes. The ratios of expressed transcripts over not expressed transcripts and of expressed OR genes over not expressed OR genes are 2.75 and 3.36, respectively.
Figure 3
Figure 3
Delta Ct values for 77 OR genes. Results of RTqPCR (means of technical triplicate for each gene), are expressed as delta Ct values (Cycle threshold), using Hprt mRNA as a reference (Ct OR-Ct Hprt). The analyses were performed on three samples and the size of the vertical bars corresponds to the standard deviation. The curve links the mean Ct values obtained with these three samples. The name of the OR genes are indicated on the x axis: in green are genes identified as expressed, in yellow the OR genes identified as weakly expressed and in red are the OR genes identified as not expressed by microarray hybridization. As indicated by the size of the vertical bars defining the cycle threshold (Ct) values for any given analyzed RNA, the amount of mRNA differs by 0.08 to 2.2 Ct between the three samples.
Figure 4
Figure 4
Differential expression of OR genes in the endoturbinates. We prepared mRNA from the four endoturbinates dissected from an adult rat. mRNA samples were used for RTqPCR (technical triplicates for each gene) for the same set of 77 OR genes. ΔΔCt values were expressed with respect to Hprt mRNA as internal reference and the control sample as external control as specified in [51]. Endoturbinate II', III and IV OR Ct values were normalized with respect to endoturbinate II OR Ct values, taken as a reference. The standard deviations are calculated from the triplicate values. Panel A is a control showing that Gapdh and Golf are expressed at similar levels in the four different endoturbinates. Panel B shows the Ct values for the OR genes that are more strongly expressed in endoturbinate II. Panel C shows OR genes with similar levels of expression in endoturbinates II and II'. In panel D, are shown OR genes more strongly expressed in endoturbinate II'; panel E presents OR genes more strongly expressed in endoturbinate III and, finally, panel F shows OR genes more strongly expressed in endoturbinate IV. On the x axis, OR gene family names follow gene names.
Figure 5
Figure 5
Expression of gene transcripts and OR transcripts at various ages. Grouping of gene transcripts and OR transcripts into three categories: expressed, weakly expressed and non expressed. In experiments describing adult olfactory epithelium mRNA profiles (Figure 1), total transcripts and OR genes were identified as being expressed when ~75% of the samples gave a corresponding hybridization signal above background levels. Similarly in the experiments described in this figure, we selected as threshold 3 in the case of each litter, 6 for the adults and 6 for the old rats. "Not expressed" total transcripts and "not expressed" OR genes did not show positive signal (above background) for any of the samples.
Figure 6
Figure 6
Expression levels of OR genes expressed at birth but not in older rats. (A) RNA samples prepared from olfactory epithelia (4 adults, 4 old rats and 19 newborns from each litter L1 to L4) were used for RTqPCR of 7 OR genes identified by microarray analysis as expressed in newborns only. Each mRNA was analyzed in triplicate and a mean value calculated. ΔCt values were calculated with respect to the Hprt values and ΔΔCt with respect to a control sample equated to 1. Further, the analyses were performed on four samples of the same group of age; error bars represent means ± SD (n = 4 rat RNA samples per group). (B) The table shows the number of samples giving a hybridization signal above background. For Olr500, taken as an example, none of the 8 adult and 8 old rat samples gave a hybridization signal above background. Conversely, all samples from the 15 newborn rats from litters L2 to L4 and three newborn rats of the four of litter L1 gave a hybridization signal above background.
Figure 7
Figure 7
Hierarchical clustering of samples for OR genes expressed in olfactory epithelium in the three age groups of rats. Numbers at the nodes (range = 1 to 100) indicate support (bootstrap value) for the clustering. Note the high bootstrap values at each node corresponding to the age groups but their much lower values for the downstream branches.
Figure 8
Figure 8
Up- and down-regulated transcripts and OR genes. Numbers of up- and down-regulated transcripts and OR genes (fold change ≥ 5) identified by pair-wise comparisons between age groups.
Figure 9
Figure 9
Box plots of RTqPCR data. The RTqPCR results detailed in Figure 10 are presented as box plots. Note the lower positions of the medians for the newborn samples and the greater dispersion of ΔΔCt values. A Mann-Whitney test performed with the 77 values calculated for the different samples confirmed that the data obtained for newborns differed from those obtained for the old and adult groups (p values < 10-10).
Figure 10
Figure 10
Relative expression of a subset of 77 OR genes at three different ages. RTqPCR was performed for 77 OR mRNAs, with olfactory epithelium mRNA prepared from 3 adult rats, 3 old rats and 9 newborn rats from three litters (L1, L2 and L4) used as a template (i.e. 15 samples, each analyzed in triplicate). Results are expressed as ΔΔCt values with Hprt taken as a reference (x axis). Gene names are distributed into four sectors, from top to bottom: (A) Gαolf, which is clearly less strongly expressed at birth and Gapdh, which is expressed at similar levels in all age groups, (B) 5 OR genes more strongly expressed at birth than later in life, (C) 43 OR genes far less strongly expressed at birth than at other ages and (D) 29 genes expressed to a similar extent at birth and at other ages or only slightly less strongly expressed at birth.

Similar articles

Cited by

References

    1. Buck L, Axel R. A novel multigene family may encode odorant receptors: a molecular basis for odor recognition. Cell. 1991;65(1):175–187. doi: 10.1016/0092-8674(91)90418-X. - DOI - PubMed
    1. Olender T, Lancet D, Nebert DW. Update on the olfactory receptor (OR) gene superfamily. Hum Genomics. 2008;3(1):87–97. - PMC - PubMed
    1. Niimura Y, Nei M. Extensive gains and losses of olfactory receptor genes in Mammalian evolution. PLoS One. 2007;2(1):e708. doi: 10.1371/journal.pone.0000708. - DOI - PMC - PubMed
    1. Quignon P, Giraud M, Rimbault M, Lavigne P, Tacher S, Morin E, Retout E, Valin AS, Lindblad-Toh K, Nicolas J. The dog and rat olfactory receptor repertoires. Genome Biol. 2005;6(10):R83. doi: 10.1186/gb-2005-6-10-r83. - DOI - PMC - PubMed
    1. Malnic B, Godfrey PA, Buck LB. The human olfactory receptor gene family. Proc Natl Acad Sci USA. 2004;101(8):2584–2589. doi: 10.1073/pnas.0307882100. - DOI - PMC - PubMed