Meta-Analysis
. 2009 Dec 2:7:84.
doi: 10.1186/1741-7007-7-84.

Increasing phylogenetic resolution at low taxonomic levels using massively parallel sequencing of chloroplast genomes

Affiliations
Meta-Analysis

Increasing phylogenetic resolution at low taxonomic levels using massively parallel sequencing of chloroplast genomes

Matthew Parks et al. BMC Biol. .

Abstract

Background: Molecular evolutionary studies share the common goal of elucidating historical relationships, and the common challenge of adequately sampling taxa and characters. Particularly at low taxonomic levels, recent divergence, rapid radiations, and conservative genome evolution yield limited sequence variation, and dense taxon sampling is often desirable. Recent advances in massively parallel sequencing make it possible to rapidly obtain large amounts of sequence data, and multiplexing makes extensive sampling of megabase sequences feasible. Is it possible to efficiently apply massively parallel sequencing to increase phylogenetic resolution at low taxonomic levels?

Results: We reconstruct the infrageneric phylogeny of Pinus from 37 nearly-complete chloroplast genomes (average 109 kilobases each of an approximately 120 kilobase genome) generated using multiplexed massively parallel sequencing. 30/33 ingroup nodes resolved with > or = 95% bootstrap support; this is a substantial improvement relative to prior studies, and shows massively parallel sequencing-based strategies can produce sufficient high quality sequence to reach support levels originally proposed for the phylogenetic bootstrap. Resampling simulations show that at least the entire plastome is necessary to fully resolve Pinus, particularly in rapidly radiating clades. Meta-analysis of 99 published infrageneric phylogenies shows that whole plastome analysis should provide similar gains across a range of plant genera. A disproportionate amount of phylogenetic information resides in two loci (ycf1, ycf2), highlighting their unusual evolutionary properties.

Conclusion: Plastome sequencing is now an efficient option for increasing phylogenetic resolution at lower taxonomic levels in plant phylogenetic and population genetic analyses. With continuing improvements in sequencing capacity, the strategies herein should revolutionize efforts requiring dense taxon and character sampling, such as phylogeographic analyses and species-level DNA barcoding.


Figures
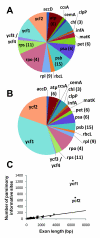
Figure 1
Figure 1
Length and information content of 71 exons common to Pinus accessions sampled in this study. A) Exon contributions to length as proportion of total exome length. B) Exon contributions to parsimony informative sites as proportion of total exome parsimony informative sites. C) Distribution of exons in relation to length and parsimony informative sites. In A) and B) most exons are shown by functional group (i.e., atp(), psb(); number of corresponding loci indicated in parentheses) for visualization purposes. In C) all exons were treated individually (N = 71). Trendline in C) based on all exons with exception of ycf1 and ycf2 to emphasize their departure from trend in other exons.
Figure 2
Figure 2
Phylogenetic relationships of 35 pines and four outgroups as determined from full plastome sequences. Support values are only shown for nodes with bootstrap/posterior probability values less than 100%/1.0, and are shown as ML bootstrap/MP bootstrap/BI posterior probability. Branch lengths calculated through RAxML analysis, and correspond to scale bar (in units of changes/nucleotide position). Inset shows topology of outgroups relative to ingroup accessions.
Figure 3
Figure 3
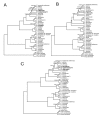
Phylogenetic relationships of 35 pines and four outgroups as determined from different data partitions. A) Full alignment without ycf1 and ycf2. B) Exon nucleotide sequences. C) Exon nucleotide sequences without ycf1 and ycf2. Support values are only shown for nodes with bootstrap/posterior probability values less than 100%/1.0, and are shown as ML bootstrap/MP bootstrap/BI posterior probability. Dashes indicate < 50% bootstrap support or < .50 posterior probability. Accessions whose position differs from that in full alignment analysis indicated in bold.
Figure 4
Figure 4
Phylogenetic relationships of 35 pines and four outgroups as determined from ycf1 and ycf2 partitions. A) ycf1 only. B) ycf2 only. C) ycf1 and ycf2 combined. Support values are only shown for nodes with bootstrap/posterior probability values less than 100%/1.0, and are shown as ML bootstrap/MP bootstrap/BI posterior probability. Dashes indicate < 50% bootstrap support or < .50 posterior probability, * indicates topological difference between either parsimony or Bayesian analyses and ML. Accessions whose position differs from that in full alignment analysis indicated in bold.
Figure 5
Figure 5
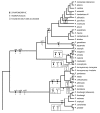
Phylogenetic distribution of exon coding indel mutations in sampled Pinus accessions. Exon names given above boxes, size of indel (bp) and polarity ("+" = insertion, "-" = deletion) given below boxes. Polarity of events determined by comparison to most distant outgroups. Due to the apparent high rate of indel formation in ycf1 and ycf2, these loci were not able to be confidently scored for indels and are not included in this diagram. Events for only the first copy of psaM are reported. Branching order of tree corresponds to RAxML analysis of complete alignment. Diagonal lines represent putative reversals of indel events. * indicates missing data for one or more accessions of clade. Thin internal branches correspond to ML bootstrap support < 95% or topological difference in four largest data partitions (full alignment and exon nucleotides, with and without ycf1 and ycf2).
Figure 6
Figure 6
Phylogenetic distribution of stop codon mutations in sampled Pinus accessions. Exon names given above boxes, amino acid shift relative to stop codon position in outgroups given below boxes. Polarity of events determined by comparison to most distant outgroups; "+" signifies extension of coding region due to stop codon mutation, "-" signifies shortening. The value of zero for the psbH- and psaM-associated events corresponds to events that alter the original stop codon without altering the total number of codons in the locus. Events for only the first copy of psaM are reported. Diagonal line represents a putative reversal in psaJ of P. parviflora. Branching order of tree corresponds to RAxML analysis of complete alignment. * indicates missing data for one or more accessions of clade. Thin internal branches correspond to ML bootstrap support < 95% or topological difference in four largest data partitions (full alignment and exon nucleotides, with and without ycf1 and ycf2).
Figure 7
Figure 7
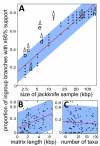
Relationships between matrix size and resolution in current study and meta-analysis of published studies. A) Parsimony resolution of jackknifed partitions (black circle) of full alignment of current study. Labelled data points (triangle) represent resolution of the following: a - Wang et al. [22], b - Gernandt et al. [21], c - Eckert and Hall [20], d - ycf2, e - ycf1, f - combined ycf1 and ycf2, g - exon nucleotides, h - complete alignment. B) Relationship between matrix length and phylogenetic resolution in published studies (N = 99). C) Relationship between number of taxa and phylogenetic resolution in published studies (N = 99). Regression lines are shown in red; 95% confidence intervals shown in blue. X-axes of A, B and C and Y-axes of B and C are in log scale.
Figure 8
Figure 8
Comparative phylogenetic resolution of Pinus species used in this study. Resolution from A) two chloroplast loci [21] and B) our complete alignment. Distance bar corresponds to 100 nucleotide changes, and is scaled for either tree. * indicate branches with < 95% (likelihood) bootstrap support in B) (likelihood and parsimony topologies were completely congruent).

References

    1. Moore MJ, Bell CD, Soltis PS, Soltis DE. Using plastid genome-scale data to resolve enigmatic relationships among basal angiosperms. Proc Natl Acad Sci USA. 2007;104:19363. doi: 10.1073/pnas.0708072104. - DOI - PMC - PubMed
    1. Delsuc F, Brinkmann H, Philippe H. Phylogenomics and the reconstruction of the tree of life. Nature Rev Genet. 2005;6:361–375. doi: 10.1038/nrg1603. - DOI - PubMed
    1. Philippe H, Frederic D, Henner B, Lartillot N. Phylogenomics. Annu Rev Ecol Evol Syst. 2005;36:541–542. doi: 10.1146/annurev.ecolsys.35.112202.130205. - DOI
    1. Jansen RK, Cai Z, Raubeson LA, Daniell H, Depamphilis CW, Leebens-Mack J, Muller KF, Guisinger-Bellian M, Haberle RC, Hansen AK. Analysis of 81 genes from 64 plastid genomes resolves relationships in angiosperms and identifies genome-scale evolutionary patterns. Proc Natl Acad Sci USA. 2007;104:19369. doi: 10.1073/pnas.0709121104. - DOI - PMC - PubMed
    1. Liston A, Parker-Defeniks M, Syring JV, Willyard A, Cronn R. Interspecific phylogenetic analysis enhances intraspecific phylogeographical inference: a case study in Pinus lambertiana. Mol Ecol. 2007;16:3926–3937. doi: 10.1111/j.1365-294X.2007.03461.x. - DOI - PubMed

Publication types

LinkOut - more resources