. 2009 Dec 2:4:42.
doi: 10.1186/1749-8104-4-42.

Gamma motor neurons express distinct genetic markers at birth and require muscle spindle-derived GDNF for postnatal survival

Affiliations

Gamma motor neurons express distinct genetic markers at birth and require muscle spindle-derived GDNF for postnatal survival

Neil A Shneider et al. Neural Dev. .

Abstract

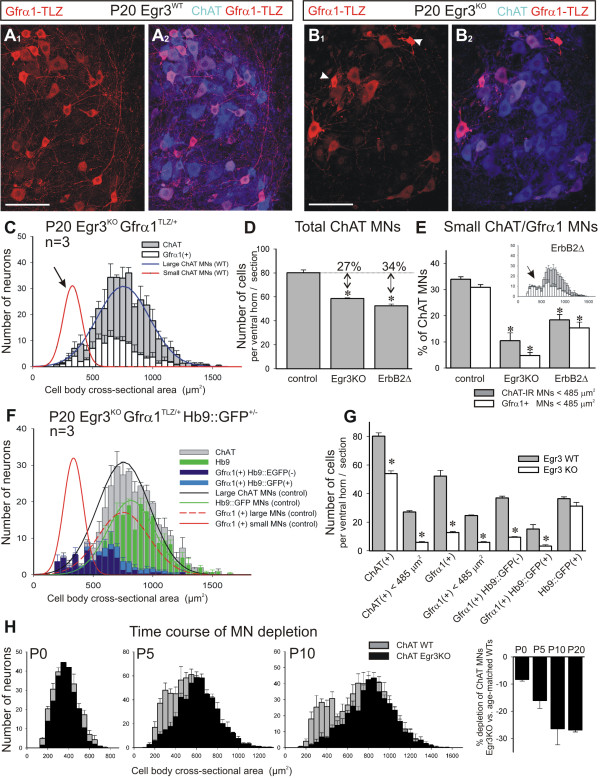
Background: Gamma motor neurons (gamma-MNs) selectively innervate muscle spindle intrafusal fibers and regulate their sensitivity to stretch. They constitute a distinct subpopulation that differs in morphology, physiology and connectivity from alpha-MNs, which innervate extrafusal muscle fibers and exert force. The mechanisms that control the differentiation of functionally distinct fusimotor neurons are unknown. Progress on this question has been limited by the absence of molecular markers to specifically distinguish and manipulate gamma-MNs. Recently, it was reported that early embryonic gamma-MN precursors are dependent on GDNF. Using this knowledge we characterized genetic strategies to label developing gamma-MNs based on GDNF receptor expression, showed their strict dependence for survival on muscle spindle-derived GDNF and generated an animal model in which gamma-MNs are selectively lost.

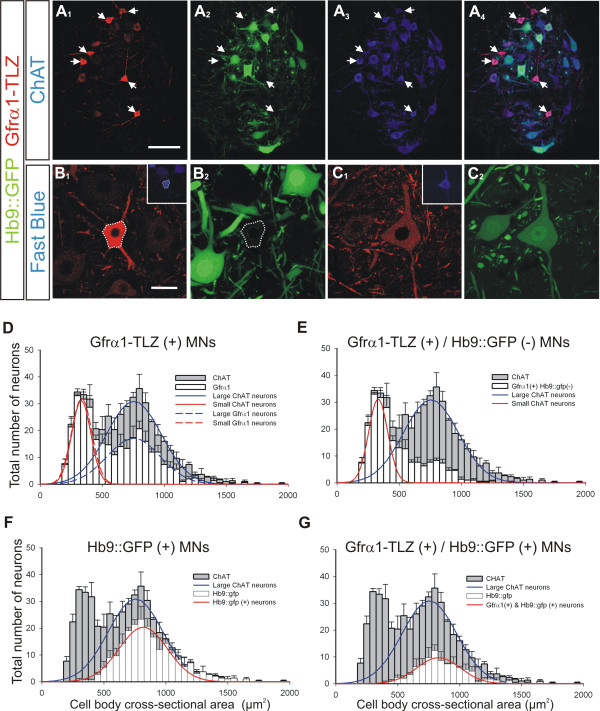
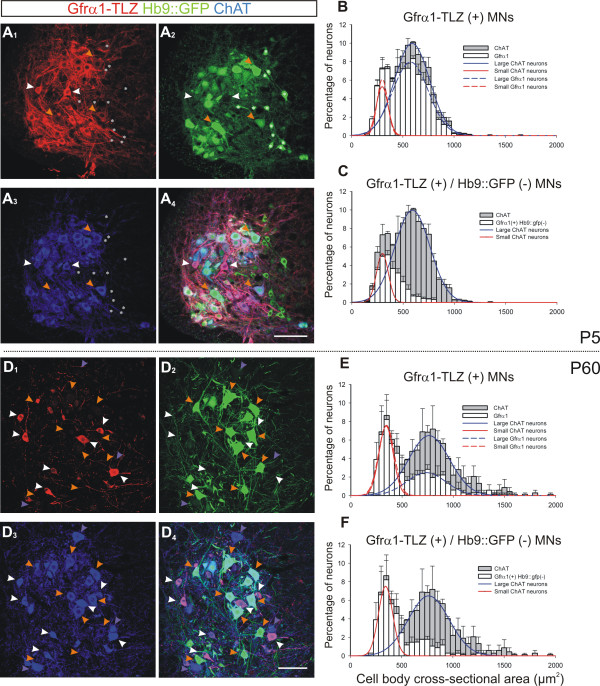
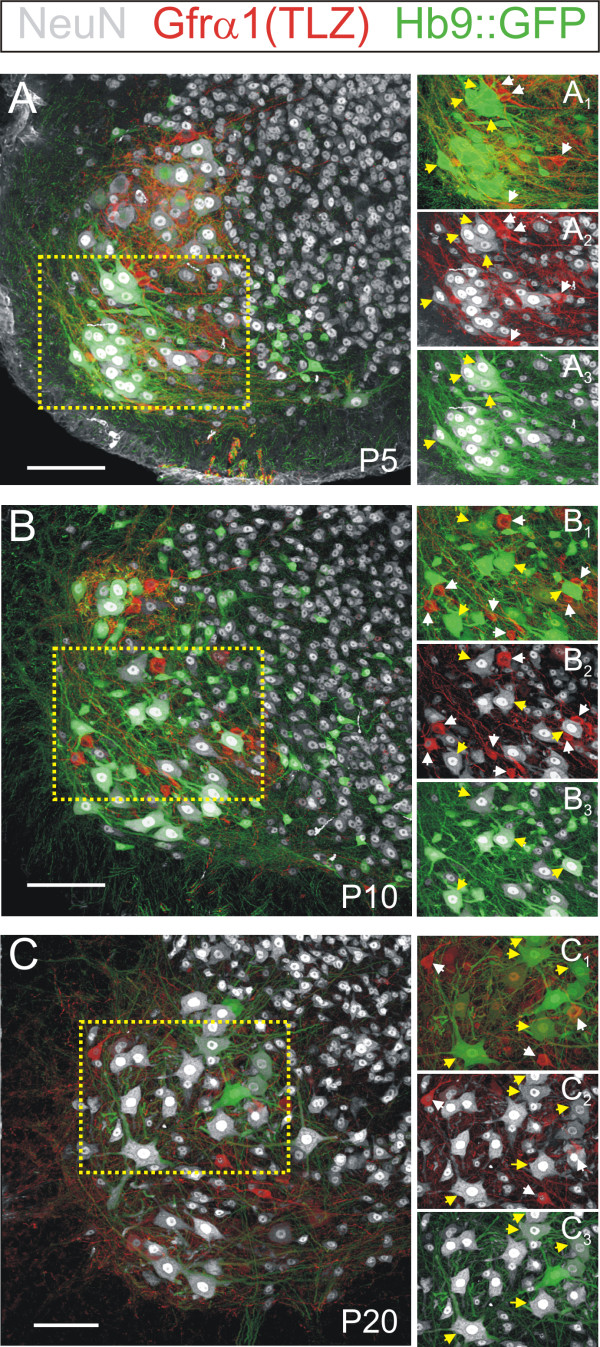
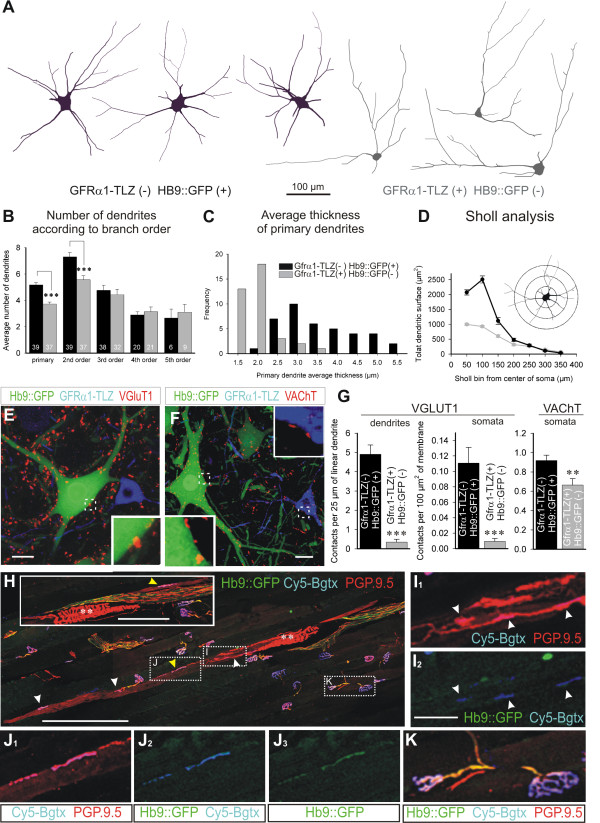
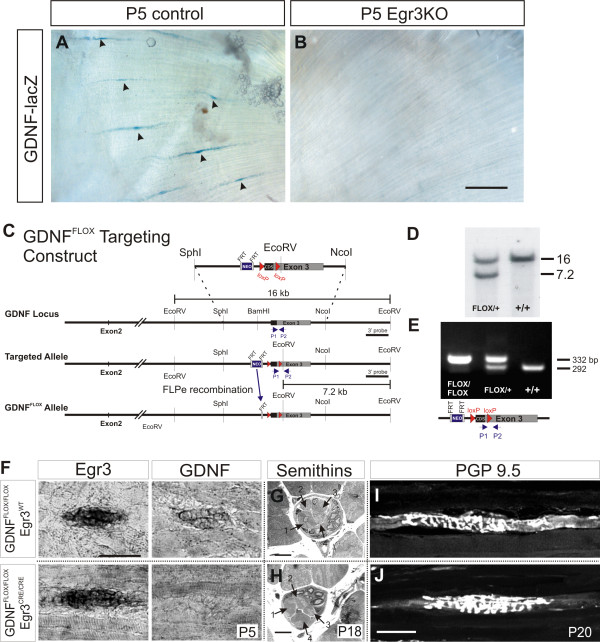
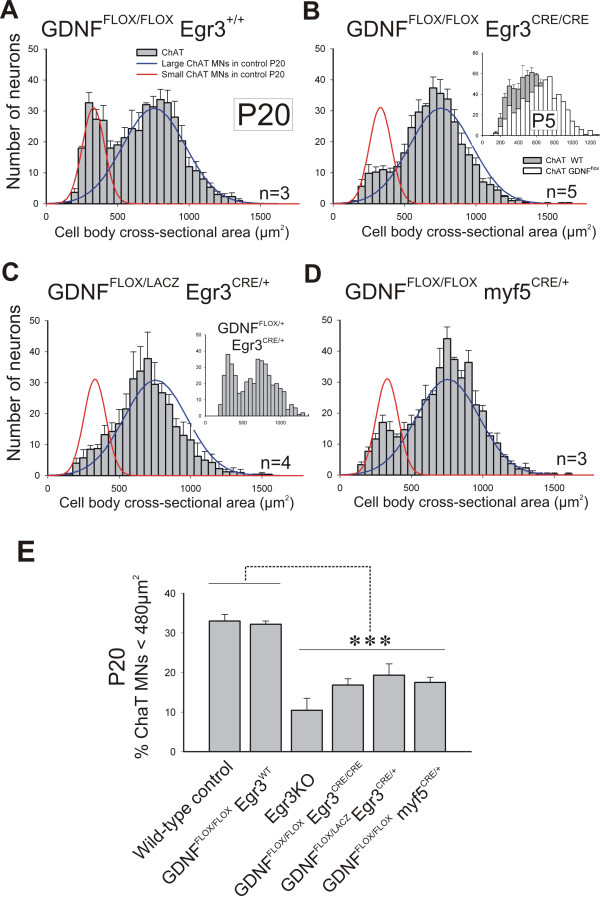
Results: In mice heterozygous for both the Hb9::GFP transgene and a tau-lacZ-labeled (TLZ) allele of the GDNF receptor Gfralpha1, we demonstrated that small motor neurons with high Gfralpha1-TLZ expression and lacking Hb9::GFP display structural and synaptic features of gamma-MNs and are selectively lost in mutants lacking target muscle spindles. Loss of muscle spindles also results in the downregulation of Gfralpha1 expression in some large diameter MNs, suggesting that spindle-derived factors may also influence populations of alpha-MNs with beta-skeletofusimotor collaterals. These molecular markers can be used to identify gamma-MNs from birth to the adult and to distinguish gamma- from beta-motor axons in the periphery. We also found that postnatal gamma-MNs are also distinguished by low expression of the neuronal nuclear protein (NeuN). With these markers of gamma-MN identity, we show after conditional elimination of GDNF from muscle spindles that the survival of gamma-MNs is selectively dependent on spindle-derived GDNF during the first 2 weeks of postnatal development.

Conclusion: Neonatal gamma-MNs display a unique molecular profile characterized by the differential expression of a series of markers - Gfralpha1, Hb9::GFP and NeuN - and the selective dependence on muscle spindle-derived GDNF. Deletion of GDNF expression from muscle spindles results in the selective elimination of gamma-MNs with preservation of the spindle and its sensory innervation. This provides a mouse model with which to explore the specific role of gamma-fusimotor activity in motor behaviors.


Figures

Figure 1
Figure 1
Small size motor neurons in postnatal day 20 mouse spinal cords are strongly Gfrα1-TLZ positive and Hb9::GFP negative. (A) Confocal images of lumbar lamina IX showing Gfrα1-Tau-lacZ (TLZ) immunoreactivity (A1, red, cy3) and Hb9::GFP expression (A2, green) in ChAT+ MNs (A3, blue, Cy5); merged images in A4. Gfrα1-TLZ strongly positive MNs are small and Hb9::GFP negative (arrows in A1-4). (B) Small, strongly Gfrα1-TLZ positive MN (B1) retrogradely labeled from tibialis anterior muscle (Fast Blue, inset). This MN lacks Hb9::GFP (B2) (cell body location outlined). (C) Medium size MN with weak Gfrα1-TLZ immunoreactivity (C1) retrogradely labeled from tibialis anterior (inset) and expressing Hb9::GFP (C2). (D-G) Cell body size distributions of all ChAT+ MNs (gray bars; 50 μm2 bins, n = 3 animals; 481 ± 14.2 ChAT+ MNs analyzed per animal in six 70-μm thick ventral horn sections; error bars represent SEMs) with superimposed (white bars) distributions for the following subpopulations: all Gfrα1-TLZ+ MNs (D), Gfrα1-TLZ+ and Hb9::GFP- MNs (E), all Hb9::GFP+ MNs (F), MNs co-expressing Gfrα1-TLZ and Hb9::GFP (G). ChAT+ MNs were fit by two Gaussian curves of different widths representing small (D and E, red solid line) and large populations (D to G, blue solid lines). Two similar curves (dashed lines) fit Gfrα1-TLZ+ MNs. Most 'small' ChAT+ MNs are Gfrα1-TLZ+. Irrespective of Gfrα1-TLZ, Hb9::GFP+ neurons (solid red lines in F and G) display unimodal size distributions of averages and standard deviations resembling large ChAT+ MNs. Scale bars: (A) 100 μm; (B) 40 μm (also applies to (C)).
Figure 2
Figure 2
Developmental downregulation of Gfrα1-TLZ and HB9::GFP expression. (A) Single optical plane confocal image through lamina IX at P5 showing Gfrα1-TLZ expression (A1, Cy3, red), Hb9::GFP (A2, green), ChAT-immunoreactivity (A3, Cy5, blue) and merged images (A4). Most ChAT+ MNs express both markers at P5, but some express strong Gfrα1-TLZ and no Hb9::GFP (white arrowheads). A few large MNs express Gfrα1-TLZ weakly (orange arrowheads), while small Hb9::GFP interneurons (ChAT-, asterisks in A-1-4) do not express Gfrα1-TLZ. (B) Size distribution of P5 ChAT+ (gray bars) and Gfrα1-TLZ+ MNs (white bars); 83.6% of ChAT+ MNs express Gfrα1-TLZ. P5 ChAT+ MNs have small/medium sizes that can be fitted by two overlapping distributions (solid lines) suggesting initial differentiation of small (red line) and large (blue line) populations. Gfrα1+ MNs (dashed lines) are fitted by a similar bimodal distribution. (C) Size distribution of P5 Gfrα1-TLZ+ and Hb9::GFP- MNs (white bars). These cells represent 28.2% of all ChAT+ MNs (gray bars) and are concentrated in small size bins. (D) Similar image series as in A, but at P60 (images are at lower magnification and four optical planes were superimposed to adjust for neuropil spread with age). Gfrα1-TLZ+/Hb9::GFP- MNs (white arrowheads) are quite distinct at this age. Gfrα1-TLZ is largely absent from large MNs and Hb9::GFP+ MNs (orange arrowheads) and many large MNs also lack Hb9::GFP (blue arrowheads). (E) P60 size distributions (as in B). Only 54.1% of ChAT+ cells express Gfrα1-TLZ, with the strongest reduction in the large population. No significant downregulation of Gfrα1-TLZ expression occurs in small ChAT+ cells. (F) At P60, 43.9% of ChAT+ MNs are Gfrα1-TLZ+ and Hb9::GFP-. Their size distribution suggests many large Gfrα1-TLZ+ MNs have lost HB9::GFP. Error bars indicate SEM; 50 μm2 bin size. At P5 average histograms from three animals, while at P60 two animals were averaged (six ventral horns analyzed per animal; 608 ± 7 and 337 ± 7 MNs analyzed per animal at P5 and P60 respectively). Scale bars: (A, B) 100 μm.
Figure 3
Figure 3
NeuN is expressed at low levels or not at all in postnatal Gfrα1-TLZ+/Hb9::GFP- motor neurons. (A) Confocal image of a P5 ventral horn showing Gfrα1-TLZ expression (Cy3, red), Hb9::GFP (green) and NeuN immunoreactive neurons (Cy5, white). All confocal planes through the 70 μm thick section and all fluorescent signals are superimposed. The lamina IX region enclosed by the dotted yellow box is shown in (A1-3) with Gfrα1-TLZ expression superimposed on Hb9::GFP (A1), Gfrα1-TLZ expression on NeuN (A2) and Hb9::GFP on NeuN (A3). (B,C) Similar image series for P10 (B,B1-3) and P20 (C,C1-3). At all ages, NeuN immunoreactivity is very low or not present at all in small MNs that are Gfrα1-TLZ+ and Hb9::GFP- (white arrows). In contrast, large Hb9::GFP+ MNs (yellow arrows) almost always express high levels of NeuN immunoreactivity. Scale bars: (A,B,C) 100 μm.
Figure 4
Figure 4
Gfrα1-TLZ+/Hb9::GFP- motor neurons display structural and synaptic characteristics of gamma motor neurons. (A) Neurolucida tracings of P20 large Gfrα1-TLZ-/Hb9::GFP+ (black) and small strongly Gfrα1-TLZ+/Hb9::GFP- MNs (gray). (B-D) Quantitative analyses of dendritic arbors. Gfrα1-TLZ-/Hb9::GFP+ MN primary dendrites are more numerous, more highly branched (B) and thicker (C), than those of Gfrα1+/Hb9::GFP- MNs. Sholl analysis (D) of Gfrα1-TLZ-/Hb9::GFP+ (black line) and Gfrα1-TLZ+/Hb9::GFP- (gray line) MNs also reveals differences in the distribution of membrane surface at different distances from soma that are characteristic of α- vs. γ-MNs. (E) VGluT1+ contacts (red) are present on P20 Hb9::GFP+ (green) MNs, but absent on Gfrα1-TLZ+ (blue)/Hb9::GFP- neurons. (F) VAChT+ contacts (red) are present on both Hb9::GFP+ (green) and Gfrα1-TLZ+ (blue)/Hb9::GFP- MNs (E and F, regions in white boxes are magnified in insets). (G) Quantification of dendritic and somatic VGluT1 and VAChT positive contacts on Hb9::GFP+ (black bars) and Gfrα1-TLZ+/Hb9::GFP- (gray bars) MNs (error bars indicate SEMs; triple and double asterisks indicate significance levels of P < 0.001 and P < 0.01 in t-test comparisons, respectively). (H-K) Tibialis anterior muscle in a Hb9::GFP mouse showing Cy5-bungarotoxin (Cy5-Bgtx, blue) labeled intra- and extrafusal neuromuscular junctions (NMJ) and PGP9.5 immunolabeled sensory and motor axons (red). Hb9::GFP+ motor axons are in green (H). Spindle afferent annulospiral endings (dual asterisks; also shown in the inset in a serial section) and intrafusal muscle fibers are labeled with PGP9.5. Extrafusal NMJs are innervated by PGP9.5+ and Hb9::GFP+ motor axons (K, high magnification of boxed area). Most motor end-plates on intrafusal fibers lacked GFP. Intrafusal Cy5-Bgtx NMJs (white arrowheads) are innervated by PGP9.5-IR axons that are HB9::GFP- (I, high magnification of boxed area). Yellow arrowheads indicate a few intrafusal NMJs innervated by PGP9.5+ and Hb9::GFP+ motor axons (example boxed and shown at higher magnification in J). Scale bars: (E,F) 20 μm; (H) 200 μm (100 μm in inset); (I,J) 25 μm.
Figure 5
Figure 5
Small diameter Gfrα1+ motor neurons are selectively lost in the muscle spindle mutant Egr3KO and ErbB2FLOX/-myf5Cre/+ animals. (A,B) Lamina IX confocal images from a P20 Egr3 wild type (A) and Egr3KO mutant (B). (A1, B1) Gfrα1-TLZ (red) and (A2,B2) superimposed with ChAT (blue). Small MNs intensely labeled with Gfrα1-TLZ are frequent in wild type but mostly absent in Egr3KO mutants. Somatic shrinkage is apparent in the few small Gfrα1-TLZ MNs found in Egr3KO mutants (arrowheads in B1). (C) Average size distribution of ChAT+ (gray bars) and Gfrα1-TLZ (white bars) MNs in P20 Egr3KO animals (n = 3 animals; error bars indicate SEM). Superimposed curves represent the wild-type distributions of small and large MNs. ChAT+ and Gfrα1-TLZ+ populations in Egr3KO mutants are both unimodal corresponding with large MNs. Small MNs are mostly absent (arrow). (D) Number of ChAT+ neurons sampled per ventral horn in 70-μm thick sections of P20 animals. Egr3KO (n = 3 animals) and Erb2Δ animals (n = 5) show significant depletions compared to controls (asterisks indicate P < 0.001, one-way ANOVA; P < 0.01 post-hoc Tukey-tests). (E) Percentages of the total ChAT+ population represented by 'small' (<485 μm2) MNs labeled with ChAT (gray bars) or Gfrα1-TLZ (white bars) in Egr3KO and Erb2Δ mutants. Both animals show a large depletion of small MNs compared to control (asterisks indicate P < 0.001, one-way ANOVA; P < 0.01 when compared to control using post-hoc Tukey-tests). In ErbΔ2 animals the reduction is not as pronounced as in Egr3KO animals despite a larger depletion in total ChAT+ MNs (D). Inset shows the average size distribution histogram in ErbΔ2 animals (gray bars, ChAT+; white bars, Gfrα1+) suggesting partial depletion of both large and small MNs. (F) Average size distribution of MNs in Egr3KO animals with different combinations of markers: ChAT+ (gray bars), Hb9::GFP+ (green bars), Gfrα1-TLZ+/Hb9::GFP- (dark blue bars) and Gfrα1-TLZ+/Hb9::GFP+ (light blue bars). Superimposed are the fitted distributions for different types of MNs in the wild-type. (G) Average number of MNs per ventral horn in each category. Asterisks denote significant differences (P < 0.001, t-test) between wild-type (gray bars) and Egr3KO mutants (white bars). Significant differences were observed in all MNs and in small MNs (<485 μm2) labeled with either ChAT or Gfrα1-TLZ. Hb9::GFP+ MNs are not significantly depleted in Egr3KO mutants, though Gfrα1-TLZ expression is downregulated in surviving large diameter MNs (F). (H) Time course of size differentiation and depletion of small MNs in Egr3KO animals. Gray bars indicate size distribution in wild type (WT; n = 3 animals for each age) and black bars in age matched Egr3KO animals (n = 2 at P0, n = 4 at P5 and P10). At P0, MN sizes are unimodal and there is a small depletion in ChAT+ neurons distributed in all size bins. At P5 there is initial differentiation of small vs. large MNs and in the Egr3KO mutant there is a larger depletion of ChAT+ MNs concentrated in the small bins. At P10 the size distribution in the wild type resolves into two discrete peaks for the small and large population and in the Egr3KO mutant the depleted neurons are clearly in the small size bins. Histogram at the right show the percentage depletions calculated in Egr3KO mutants of different ages. Scale bars: (A1, B1) 100 μm.
Figure 6
Figure 6
Loss of muscle spindle-derived GDNF in the Egr3KO and GDNFFLOX/Egr3CRE conditional mutant mouse. (A,B) GDNF (lacZ) is expressed in muscle spindles (black arrowheads) in P5 control gluteus maximus (GDNFlacZ/-/Egr3+/-) but absent in mutants (GDNFlacZ/-/Egr3KO). (C) Conditional gene targeting; loxP sites were introduced in the targeting construct around the GDNF gene coding sequence (CDS) before exon 3. An FRT-flanked neomycin-resistance (Neo) expression cassette was inserted upstream of the 5' loxP site and excised by crossing to ACTB-FLPe mice [14] to generate the GDNFFLOX allele. (D) Southern blot analysis of genomic DNA from mouse tails. Wild-type (+/+) and GDNFFLOX alleles are represented by 16 and 7.2 kb bands, respectively. (E) GDNFFLOX/FLOX and GDNFFLOX/+ mice were identified by PCR using primers P1 and P2 (shown as arrowheads) that flank the 3' loxP inserted in the 3' untranslated region of the GDNF gene. (F) In situ hybridization of P5 GDNFFLOX/FLOX/Egr3CRE/CRE mutant and GDNFFLOX/FLOX/Egr3WT control hindlimb muscle spindles with probes for Egr3 and GDNF. Analysis was performed on 10 μm-thick contiguous cryosections to demonstrate co-expression of Egr3 and GDNF in control and lack of GDNF expression in mutant muscle spindles after Cre recombination. (G,H) Semithin (1 μm) sections showing that control (G) and mutant spindles (H) have the same number of intrafusal muscle fibers (indicated by numbered arrows). (I,J) PGP9.5-immunoreactive annulospiral endings are similar in P20 GDNFFLOX/FLOX (no Cre) control (G) and in GDNFFLOX/FLOX/Egr3CRE/CRE animals (H). Scale bars: (B) 200 μm; (F), 50 μm; (H) 10 μm; (J) 50 μm.
Figure 7
Figure 7
Genetic elimination of muscle spindle-derived GDNF results in selective loss of gamma motor neurons. (A) Size distributions of ChAT+ MNs in GDNFFLOX/FLOX/Egr3WT (no Cre) controls at P20 are comparable to wild types (lines). (B) ChAT+ MNs losses in the absence of spindle-derived GDNF (GDNFFLOX/FLOX/Egr3CRE/CRE mutants). Small ChAT+ MNs represent 32 ± 1% ( ± SEM) of all MNs in GDNFFLOX/FLOX /Egr3+/+ and 16.8 ± 1.1% in GDNFFLOX/FLOX/Egr3CRE/CRE animals. Inset shows a depletion at P5 comparable to Egr3KO animals (see Figure 5F). (C) Similar loses in compound heterozygotes with one conditional and one null GDNF allele and a single copy of Egr3CRE (GDNFFLOX/LACZ/Egr3CRE/+). Inset shows a normal size distribution in one animal carrying one wild type and one floxed GDNF allele and a single Egr3CRE copy. (D) GDNF elimination from all muscle precursors using myf5CRE/+ results in similar losses of small ChAT+ MNs. Large MN numbers are unaffected in conditional mutants by targeted removal of GDNF from spindles. (E) Comparison of the percentage of small MNs (<480 μm2) in different genotypes. No differences were detected between wild-type and homozygous GDNFFLOX (no Cre) controls. Egr3KO mutants and several conditional/floxed GDNF mutants crossed to Egr3CRE or myf5CRE showed significant depletions compared to wild-types and GDNFFLOX (no Cre) controls (asterisks indicate P < 0.001 one-way ANOVA followed by P < 0.01 post-hoc Tukey comparisons). Depletion of small MNs in Egr3KO animals were more pronounced than in other genotypes, but differences were not statistically significant. N's, number of animals analyzed in each genotype.

Similar articles

Cited by

References

    1. Hulliger M. The mammalian muscle spindle and its central control. Rev Physiol Biochem Pharmacol. 1984;101:1–110. full_text. - PubMed
    1. Adal MN, Barker D. Intramuscular Branching of Fusimotor Fibres. J Physiol. 1965;177:288–299. - PMC - PubMed
    1. Bessou P, Emonet-Denand F, Laporte Y. Motor fibres innervating extrafusal and intrafusal muscle fibres in the cat. J Physiol. 1965;180:649–672. - PMC - PubMed
    1. Laporte Y, Emonet-Denard F, Jami L. The skeleto-fusimotor or beta-innervation of mammalian muscle spinldes. TINS. 1981;4:97–99.
    1. Prochazka A. Exercise: Regulation and Integration of Multiple Systems. Volume sect. 12. Bethesda, MD: Am Physiol Soc; 1996. Proprioceptive feedback and movement regulation; pp. 89–127. Handbook of Physiology.

Publication types

MeSH terms

Substances

LinkOut - more resources