. 2010 Jan;11(1):40-79.
doi: 10.1093/bib/bbp043. Epub 2009 Dec 2.

Pathway Tools version 13.0: integrated software for pathway/genome informatics and systems biology

Affiliations

Pathway Tools version 13.0: integrated software for pathway/genome informatics and systems biology

Peter D Karp et al. Brief Bioinform. 2010 Jan.

Abstract

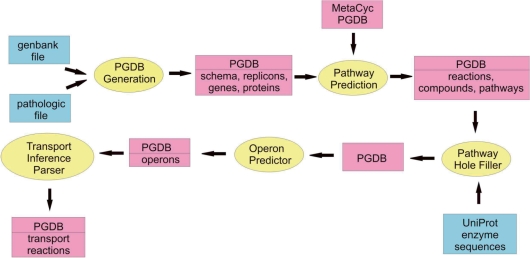
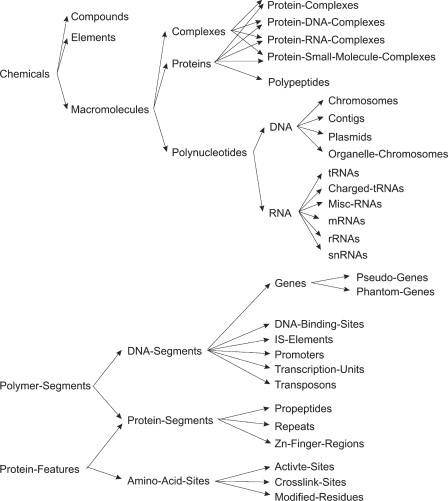
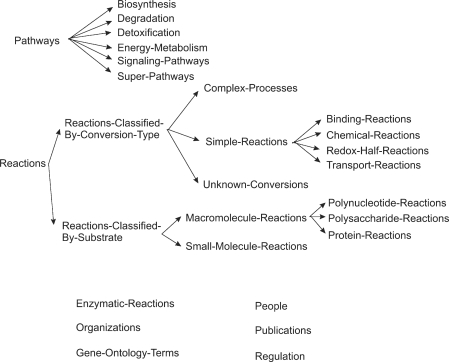
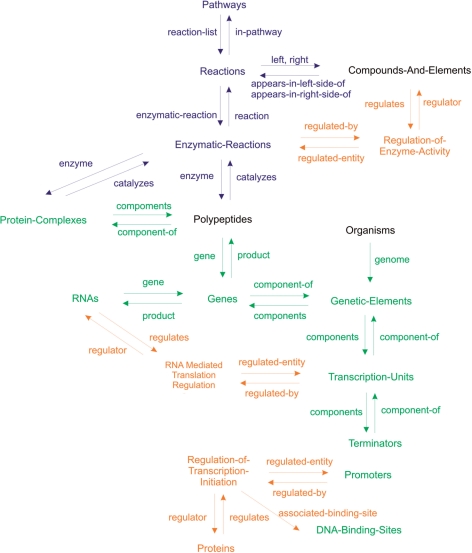
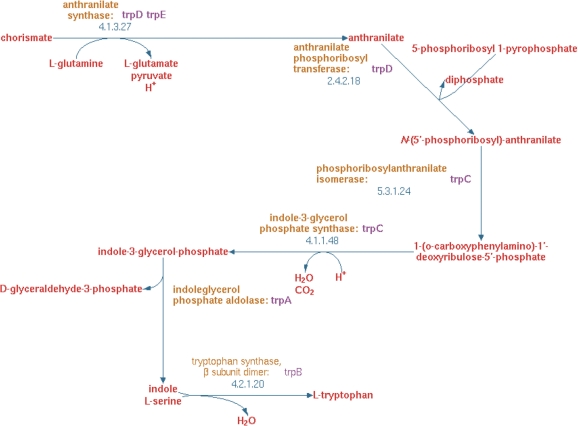
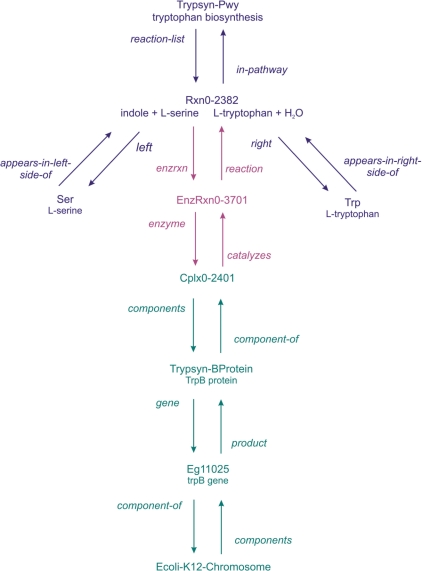
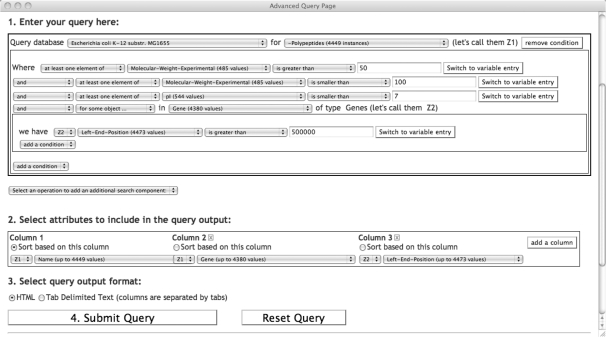
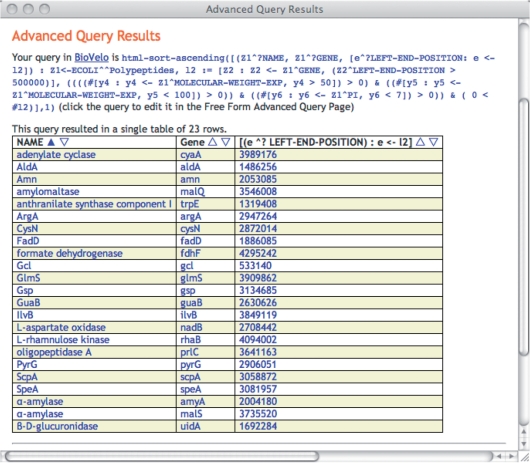
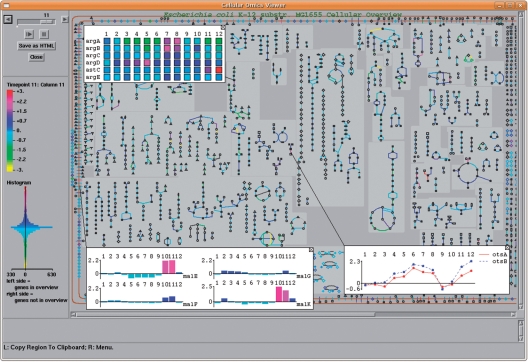
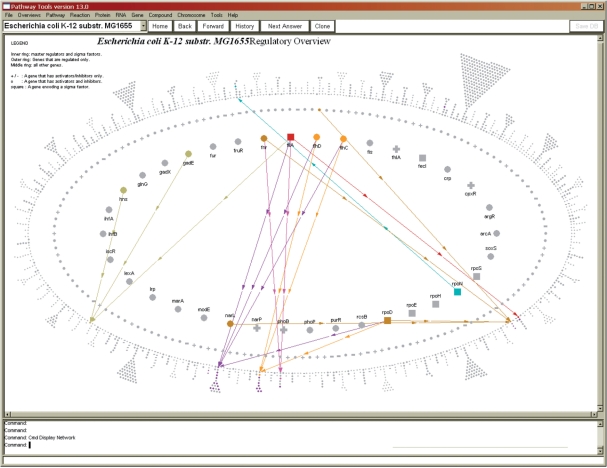
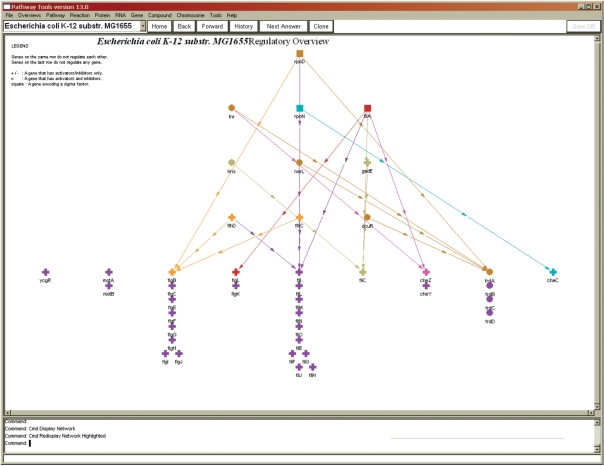
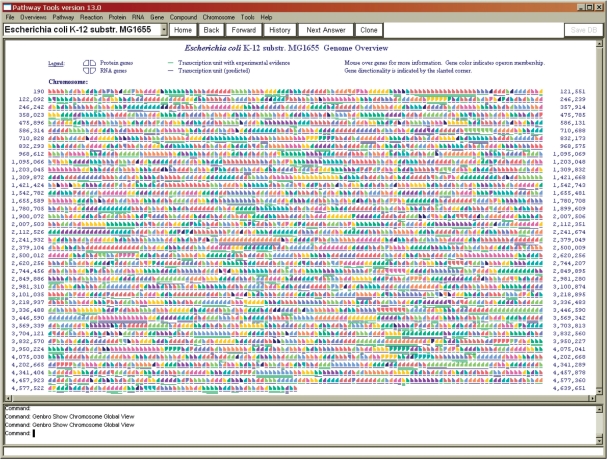
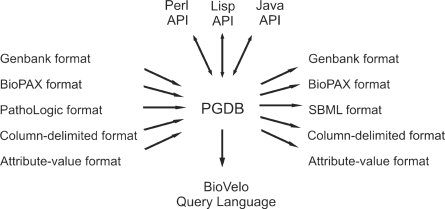
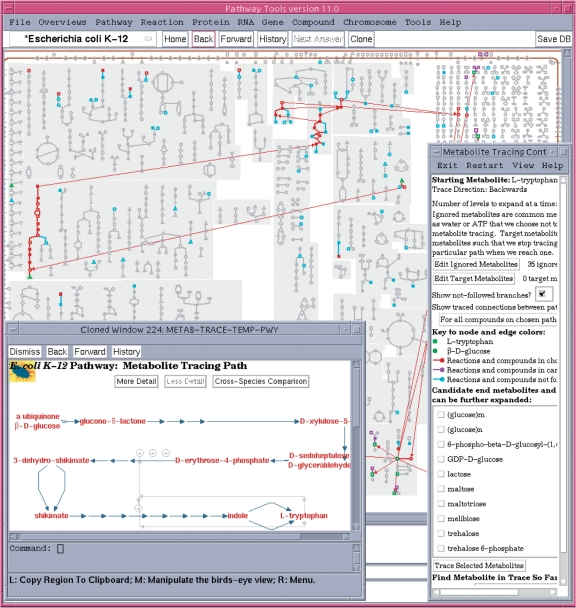
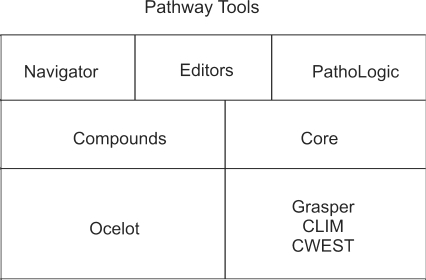
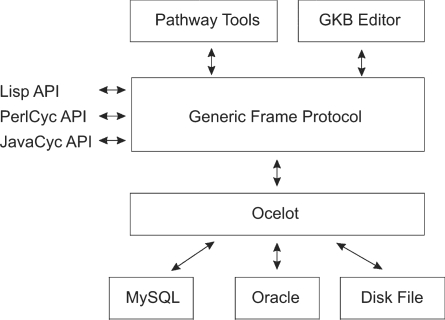
Pathway Tools is a production-quality software environment for creating a type of model-organism database called a Pathway/Genome Database (PGDB). A PGDB such as EcoCyc integrates the evolving understanding of the genes, proteins, metabolic network and regulatory network of an organism. This article provides an overview of Pathway Tools capabilities. The software performs multiple computational inferences including prediction of metabolic pathways, prediction of metabolic pathway hole fillers and prediction of operons. It enables interactive editing of PGDBs by DB curators. It supports web publishing of PGDBs, and provides a large number of query and visualization tools. The software also supports comparative analyses of PGDBs, and provides several systems biology analyses of PGDBs including reachability analysis of metabolic networks, and interactive tracing of metabolites through a metabolic network. More than 800 PGDBs have been created using Pathway Tools by scientists around the world, many of which are curated DBs for important model organisms. Those PGDBs can be exchanged using a peer-to-peer DB sharing system called the PGDB Registry.


Figures

Figure 1:
Figure 1:
Inputs and outputs of the computational inference modules within PathoLogic. The initial input to PathoLogic is either a Genbank or a PathoLogic-format file. The boxes labeled “PGDB” all indicate that a PGDB is an input to or an output from some processing step; the notations at the bottom of the PGDB boxes indicate what types of data have been added by the previous processing step, for example, the Transport Inference Parser (TIP) adds transport reactions to a PGDB.
Figure 2:
Figure 2:
First set of major classes within the Pathway Tools schema, shown in a class–subclass hierarchy. Many of these classes have many subclasses that are not shown.
Figure 3:
Figure 3:
Second set of major classes within the Pathway Tools schema, shown in a class–subclass hierarchy. The classes shown at the bottom have no subclasses.
Figure 4:
Figure 4:
Major relationships among the major classes of the Pathway Tools schema. Colors indicate biological areas: blue for reaction and pathway information; green for genome and protein information; and orange for regulation.
Figure 5:
Figure 5:
The biosynthetic pathway for l-tryptophan in EcoCyc.
Figure 6:
Figure 6:
Some of the PGDB objects representing the pathway for l-tryptophan biosynthesis, and their connections.
Figure 7:
Figure 7:
A query for the E. coli polypeptides whose experimental molecular weight lies between 50 and 100 kDa, whose pI is smaller than 7, and whose gene is located after the first 500 kb of the genome. An output column is used to include the gene (or sometimes genes) producing each polypeptide using the second variable Z2.
Figure 8:
Figure 8:
The output result of the query in Figure 7. The BioVelo query generated from the user selection of Figure 7 is also shown near the top of the page.
Figure 9:
Figure 9:
The PathwayTools Cellular Overview diagram for EcoCyc, painted with gene expression data. Three omics popups show expression data for individual genes in each of the three supported styles: heat map, X-Y plot, and bar graph. The top (heat map) and right (X-Y plot) popups include values for all the genes in their respective pathways. The bottom left popup (bar graph format) shows expression of all genes involved in one transport reaction.
Figure 10:
Figure 10:
The Pathway Tools Regulatory Overview diagram for EcoCyc. The diagram depicts a full regulatory network as three concentric rings: the inner ring contains master regulator genes; the middle ring contains other regulators; and the outer ring contains genes that are not regulators. An arrow (edge) from gene A to gene B indicates that gene A regulates gene B. Initially, no arrows are shown; the user can interactively add arrows, such as by clicking on a gene and requesting that arrows are added to genes that it regulates, or from the genes that regulate it.
Figure 11:
Figure 11:
Layer cake layout of the regulatory network from Figure 10.
Figure 12:
Figure 12:
Pathway Tools Genome Overview diagram for EcoCyc. Adjacent genes drawn in the same color are in the same operon. Left/right gene direction indicates transcription direction; up/down gene direction indicates genes coding for proteins versus RNAs. Horizontal lines under genes indicate transcript extents based on promoter and terminator information in the PGDB.
Figure 13:
Figure 13:
Pathway Tools supported formats for data import/export, APIs for data access/update and DB query language (BioVelo).
Figure 14:
Figure 14:
Metabolite Tracing Facility. The main window shows the cellular overview diagram, highlighting the path backward from tryptophan to glucose. The control panel, which includes a color key and options for extending or altering the trace, is superimposed on the main window, on the right. The bottom left window shows the traced path using the conventional pathway display.
Figure 15:
Figure 15:
Pathway Tools architecture (vertical lines have no meaning other than separation of components; for example, all components in the top layer call all components in the middle layer). Each box depicts a major component of Pathway Tools. The bottom layer includes Ocelot and the graphics components. Above that layer are low-level libraries within Pathway Tools for manipulating chemical compounds and other datatypes, which in turn are called by the Navigator, Editors and PathoLogic.
Figure 16:
Figure 16:
Storage architecture of Pathway Tools.
Figure 17:
Figure 17:
Graphics architecture of Pathway Tools.

Similar articles

  • The Pathway Tools software.
    Karp PD, Paley S, Romero P. Karp PD, et al. Bioinformatics. 2002;18 Suppl 1:S225-32. doi: 10.1093/bioinformatics/18.suppl_1.s225. Bioinformatics. 2002. PMID: 12169551
  • The MetaCyc database of metabolic pathways and enzymes and the BioCyc collection of pathway/genome databases.
    Caspi R, Altman T, Dale JM, Dreher K, Fulcher CA, Gilham F, Kaipa P, Karthikeyan AS, Kothari A, Krummenacker M, Latendresse M, Mueller LA, Paley S, Popescu L, Pujar A, Shearer AG, Zhang P, Karp PD. Caspi R, et al. Nucleic Acids Res. 2010 Jan;38(Database issue):D473-9. doi: 10.1093/nar/gkp875. Epub 2009 Oct 22. Nucleic Acids Res. 2010. PMID: 19850718 Free PMC article.
  • The MetaCyc database of metabolic pathways and enzymes and the BioCyc collection of pathway/genome databases.
    Caspi R, Altman T, Dreher K, Fulcher CA, Subhraveti P, Keseler IM, Kothari A, Krummenacker M, Latendresse M, Mueller LA, Ong Q, Paley S, Pujar A, Shearer AG, Travers M, Weerasinghe D, Zhang P, Karp PD. Caspi R, et al. Nucleic Acids Res. 2012 Jan;40(Database issue):D742-53. doi: 10.1093/nar/gkr1014. Epub 2011 Nov 18. Nucleic Acids Res. 2012. PMID: 22102576 Free PMC article.
  • Pathway Tools version 23.0 update: software for pathway/genome informatics and systems biology.
    Karp PD, Midford PE, Billington R, Kothari A, Krummenacker M, Latendresse M, Ong WK, Subhraveti P, Caspi R, Fulcher C, Keseler IM, Paley SM. Karp PD, et al. Brief Bioinform. 2021 Jan 18;22(1):109-126. doi: 10.1093/bib/bbz104. Brief Bioinform. 2021. PMID: 31813964 Free PMC article. Review.
  • The EcoCyc Database.
    Karp PD, Ong WK, Paley S, Billington R, Caspi R, Fulcher C, Kothari A, Krummenacker M, Latendresse M, Midford PE, Subhraveti P, Gama-Castro S, Muñiz-Rascado L, Bonavides-Martinez C, Santos-Zavaleta A, Mackie A, Collado-Vides J, Keseler IM, Paulsen I. Karp PD, et al. EcoSal Plus. 2018 Nov;8(1):10.1128/ecosalplus.ESP-0006-2018. doi: 10.1128/ecosalplus.ESP-0006-2018. EcoSal Plus. 2018. PMID: 30406744 Free PMC article. Review.

Cited by

References

    1. Karp P, Paley S. Integrated access to metabolic and genomic data. J Comput Biol. 1996;3:191–212. - PubMed
    1. Karp PD, Paley S, Romero P. The Pathway Tools Software. Bioinformatics. 2002;18:S225–32. - PubMed
    1. Paley SM, Karp PD. The Pathway Tools cellular overview diagram and omics viewer. Nucleic Acids Res. 2006;34:3771–8. - PMC - PubMed
    1. Ouzounis C, Karp PD. Global properties of the metabolic map of Escherichia coli. Genome Res. 2000;10:568. - PMC - PubMed
    1. Karp PD. Pathway databases: a case study in computational symbolic theories. Science. 2001;293:2040–4. - PubMed

Publication types