. 2010 Feb;152(2):656-69.
doi: 10.1104/pp.109.147975. Epub 2009 Dec 2.

An O-acetylserine(thiol)lyase homolog with L-cysteine desulfhydrase activity regulates cysteine homeostasis in Arabidopsis

Affiliations

An O-acetylserine(thiol)lyase homolog with L-cysteine desulfhydrase activity regulates cysteine homeostasis in Arabidopsis

Consolación Alvarez et al. Plant Physiol. 2010 Feb.

Abstract

Cysteine (Cys) occupies a central position in plant metabolism due to its biochemical functions. Arabidopsis (Arabidopsis thaliana) cells contain different O-acetylserine(thiol)lyase (OASTL) enzymes that catalyze the biosynthesis of Cys. Because they are localized in the cytosol, plastids, and mitochondria, this results in multiple subcellular Cys pools. Much progress has been made on the most abundant OASTL enzymes; however, information on the less abundant OASTL-like proteins has been scarce. To unequivocally establish the enzymatic reaction catalyzed by the minor cytosolic OASTL isoform CS-LIKE (for Cys synthase-like; At5g28030), we expressed this enzyme in bacteria and characterized the purified recombinant protein. Our results demonstrate that CS-LIKE catalyzes the desulfuration of L-Cys to sulfide plus ammonia and pyruvate. Thus, CS-LIKE is a novel L-Cys desulfhydrase (EC 4.4.1.1), and we propose to designate it DES1. The impact and functionality of DES1 in Cys metabolism was revealed by the phenotype of the T-DNA insertion mutants des1-1 and des1-2. Mutation of the DES1 gene leads to premature leaf senescence, as demonstrated by the increased expression of senescence-associated genes and transcription factors. Also, the absence of DES1 significantly reduces the total Cys desulfuration activity in leaves, and there is a concomitant increase in the total Cys content. As a consequence, the expression levels of sulfur-responsive genes are deregulated, and the mutant plants show enhanced antioxidant defenses and tolerance to conditions that promote oxidative stress. Our results suggest that DES1 from Arabidopsis is an L-Cys desulfhydrase involved in maintaining Cys homeostasis, mainly at late developmental stages or under environmental perturbations.


Figures
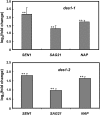
Figure 1.
Figure 1.
Relative expression levels of senescence-associated genes in des1 mutant plants. Real-time RT-PCR analysis of the expression of SEN1 (At4g35770), SAG21 (At4g02380), and NAP (At1g69490) genes was performed in leaves from Col-0 and No-0 wild-type and des1-1 and des1-2 mutant plants grown for 5 weeks under control conditions. The transcript levels were normalized to the internal control, the constitutive UBQ10 gene. Data shown are means + sd of three independent analyses made from RNA obtained from different plants grown in different pots at the same time, and they represent the transcript level of each gene in the mutant plants relative to the transcript level in the corresponding wild-type ecotype. ANOVA was performed using the software OriginPro 7.5. ** P < 0.05.
Figure 2.
Figure 2.
Relative expression levels of the OASTL gene family in the des1-1 mutant plants. Real-time RT-PCR analysis of the expression of the OAS-A1 (At4g14880), OAS-B (At2g43750), OAS-C (At3g59760), CS-26 (At3g03630), CYS-C1 (At3g61440), CYS-D1 (At3g04940), and CYS-D2 (At5g28020) genes was performed in leaves from the wild-type Col-0 and des1-1 mutant plants grown for 5 weeks under control conditions. The transcript levels were normalized to the constitutive UBQ10 gene. Data shown are means + sd of three independent analyses made from RNA obtained from different plants grown in different pots at the same time, and they represent the transcript level of each gene in the mutant plants relative to the transcript level in the wild-type plants. ANOVA was performed using the software OriginPro 7.5. ** P < 0.05.
Figure 3.
Figure 3.
Sulfate regulation of the expression levels of sulfur-responsive genes in the Col-0 wild-type (wt) and des1-1 mutant plants. Real-time RT-PCR analysis of expression of the SULTR1.2 (At1g78000), SULTR2.1 (At5g10180), SULTR2.2 (At1g77990), SULTR3.1 (At3g51895), APR1 (At4g04610), APR2 (At1g62180), and APR3 (At4g21990) genes was performed in leaves from the Col-0 wild-type and des1-1 mutant plants grown in soil and irrigated with Hoagland medium (control conditions) or deionized water (low-sulfate conditions). The transcript levels were normalized using the constitutive UBQ10 gene as an internal control. Data shown are means ± sd of three independent analyses made from RNA obtained from different plants grown in different pots at the same time and are divided into two different graphs due to the different scales. ANOVA was performed using the software OriginPro 7.5. Significant differences between each plant line grown under low-sulfate and control conditions are indicated by the letter a (P < 0.05). Significant differences between des1-1 and wild-type plants grown under control conditions are indicated by the letter b (P < 0.05). Significant differences between des1-1 and wild-type plants grown under low-sulfate conditions are indicated by the letter c (P < 0.05).
Figure 4.
Figure 4.
Sensitivity of the des1-1 and des1-2 mutant plants to Cd stress. A, Col-0 and No-0 wild-type and mutant seeds were germinated on solid MS medium containing varying concentrations of CdCl2 as stated, and photographs were taken after 14 d of growth. B, The tolerance to Cd was calculated as the ratio of the total number of live seedlings to the total number of sown seeds after 14 d of growth in the presence of different concentrations of Cd. Data shown are means ± sd of three independent analyses made in separate batches at different times. ANOVA was performed using the software OriginPro 7.5. Significant differences between the wild-type plants grown in the presence and absence of Cd are indicated by the letter a (P < 0.05). Significant differences between the mutant plants grown in the presence and absence of Cd are indicated by the letter b (P < 0.05). Significant differences between the mutant plants and their respective wild-type plants grown in 175 μm Cd are indicated by the letter c (P < 0.05). Significant differences between the mutant plants and their respective wild-type plants grown in 250 μm Cd are indicated by the letter d (P < 0.05). [See online article for color version of this figure.]
Figure 5.
Figure 5.
Fluorescence microscopic detection of H2O2 in root tissues and quantification in whole seedlings after Cd treatment. A, Roots from 5-d-old wild-type Col-0 and des1-1 mutant plants grown on solid MS medium were soaked for 10 min in the absence or presence of 250 μm CdCl2, rinsed with water, and then loaded with H2DCFDA for 5 min in the presence of propidium iodide to visualize cell walls (pseudocolored in red) by confocal microscopy. H2O2 is pseudocolored in green. The experiments were repeated using roots from plants grown on different plates at least five times with similar results. B, Whole 2-week-old wild-type Col-0 and des1-1 seedlings grown on solid MS medium were subjected to the same Cd treatment, then harvested and ground, and H2O2 was quantified by H2DCFDA fluorescence as described in “Materials and Methods.” Data shown are means ± sd of three independent analyses made in seedlings grown on different plates. ANOVA was performed using the software OriginPro 7.5. Significant differences between Cd-treated and untreated wild-type plants are indicated by the letter a (P < 0.05). Significant differences between Cd-treated des1-1 mutant and Cd-treated wild-type plants are indicated by the letter b (P < 0.05).
Figure 6.
Figure 6.
Sensitivity of the des1-1 and des1-2 mutant plants to oxidative stress. A, Col-0 and No-0 wild-type and mutant seeds were germinated on solid MS medium containing varying concentrations of H2O2 as stated, and photographs were taken after 10 d of growth. B, The tolerance to H2O2 was calculated as the ratio of the total number of live seedlings to the total number of sown seeds after 10 d of growth in the presence of different concentrations of H2O2. Data shown are means ± sd of three independent analyses made in separate batches at different times. ANOVA was performed using the software OriginPro 7.5. Significant differences between wild-type plants grown in 6 mm H2O2 and in the absence of H2O2 are indicated with the letter a (P < 0.05). Significant differences between the mutant plants and their respective wild-type plants grown in 6 mm H2O2 are indicated with the letter b (P < 0.05). [See online article for color version of this figure.]
Figure 7.
Figure 7.
APX and guaiacol peroxidase (GPX) activity levels in the des1-1 and des1-2 mutant plants. A, In-gel activity of APX in leaf extracts. Leaf protein extracts (30 μg) were loaded in parallel onto two nondenaturing polyacrylamide gels; after electrophoresis, one gel was stained to develop the APX activity and the other was stained with Coomassie Brilliant Blue as described in “Materials and Methods.” The Coomassie Brilliant Blue-stained gel is shown in Supplemental Figure S5. The quantification of each APX activity band relative to the Coomassie Brilliant Blue-stained band was calculated with Quantity One software. The experiment was repeated at least three times with similar results. B, Guaiacol peroxidase activity determined in leaf extracts from Col-0 and No-0 wild-type and mutant plants as described in “Materials and Methods.” Values are means ± sd from three independent experiments made using leaf extracts obtained from different plants grown in different pots. Percentages with regard to the respective wild type are given in parentheses. ANOVA was performed using the software OriginPro 7.5. ** P < 0.05.

References

    1. Alonso JM, Stepanova AN, Leisse TJ, Kim CJ, Chen H, Shinn P, Stevenson DK, Zimmerman J, Barajas P, Cheuk R, et al (2003) Genome-wide insertional mutagenesis of Arabidopsis thaliana. Science 301 653–657 - PubMed
    1. Barroso C, Vega JM, Gotor C (1995) A new member of the cytosolic O-acetylserine(thiol)lyase gene family in Arabidopsis thaliana. FEBS Lett 363 1–5 - PubMed
    1. Berkowitz O, Wirtz M, Wolf A, Kuhlmann J, Hell R (2002) Use of biomolecular interaction analysis to elucidate the regulatory mechanism of the cysteine synthase complex from Arabidopsis thaliana. J Biol Chem 277 30629–30634 - PubMed
    1. Blaszczyk A, Brodzik R, Sirko A (1999) Increased resistance to oxidative stress in transgenic tobacco plants overexpressing bacterial serine acetyltransferase. Plant J 20 237–243 - PubMed
    1. Bogdanova N, Hell R (1997) Cysteine synthesis in plants: protein-protein interactions of serine acetyltransferase from Arabidopsis thaliana. Plant J 11 251–262 - PubMed

Publication types

MeSH terms