. 2010 Feb;84(4):2150-6.
doi: 10.1128/JVI.01737-09. Epub 2009 Dec 2.

Leflunomide inhibition of BK virus replication in renal tubular epithelial cells

Affiliations

Leflunomide inhibition of BK virus replication in renal tubular epithelial cells

Eva Bernhoff et al. J Virol. 2010 Feb.

Abstract

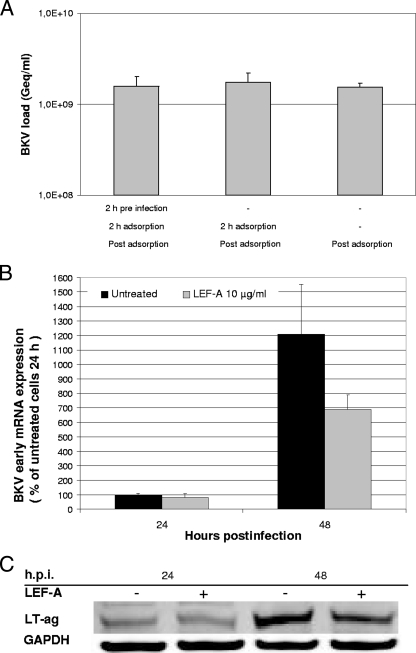
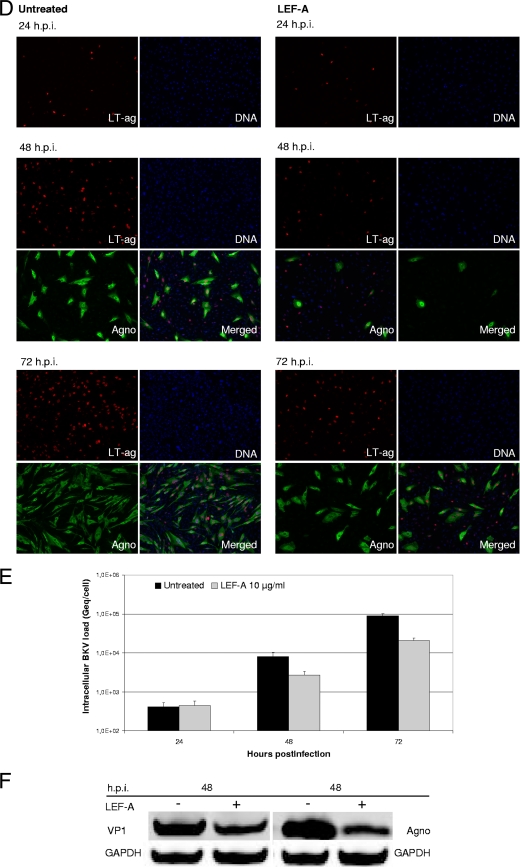
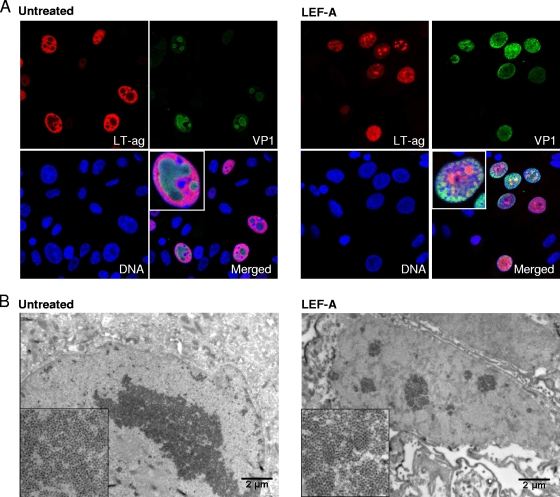
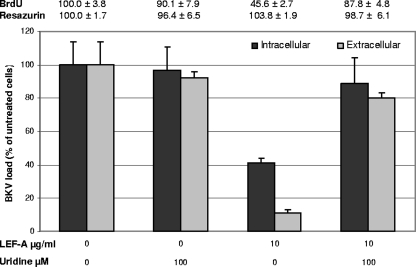
The immunomodulatory drug leflunomide is frequently used for treating polyomavirus-associated nephropathy, yet its antiviral mechanism is unclear. We characterized the effects of the active leflunomide metabolite A771726 (LEF-A) on the polyomavirus BK (BKV) life cycle in human renal tubular epithelial cells. LEF-A at 10 microg/ml reduced the extracellular BKV load by 90% (IC(90)) but with significant host cytostatic effects. BKV genome replication, late protein expression, and virion assembly and release were inhibited with visible disruption of the nuclear replication architecture. Both host cell and antiviral effects were largely reversed by uridine addition, implicating nonspecific pyrimidine depletion as the major anti-BKV mechanism of leflunomide.


Figures

FIG. 1.
FIG. 1.
Effect of LEF-A titration on BKV load and RPTEC cytotoxicity. RPTECs (Lonza) (passage 4) were seeded in 24- or 96-well plates and supernatant infected with BKV-Dunlop at 50% confluency from Vero cells (multiplicity of infection [MOI] of 1) or left uninfected. At 2 h.p.i., virus or supernatant was removed, cells were washed, and medium with increasing LEF-A concentrations (A771726; Calbiochem) or without LEF-A was added. (A) Supernatants were harvested 72 h.p.i., and extracellular BKV loads were measured by qPCR with primers and probe targeting the LT-ag gene (5). Data are presented as Geq/ml (Geq = genome equivalents). (B) The cytotoxicity of LEF-A was monitored 72 h.p.i. by measuring cellular DNA replication by cell proliferation enzyme-linked immunosorbent assay (ELISA), BrdU (Roche Applied Science) (5), mitochondrial metabolic activity with cell proliferation reagent WST-1 (Roche Applied Science) (5), and total cellular metabolic activity (monotoring mithochondrial, microsomal, and cytosolic enzymes) with the resazurin-based assay TOX-8 (Sigma-Aldrich). For all three assays, colorimetric measurements were performed as described by the manufacturer. Absorbance for untreated cells was set as 100%.
FIG. 2.
FIG. 2.
Influence of LEF-A on different steps in the BKV life cycle. RPTECs were seeded and infected as described earlier. (A) The influence of LEF-A on BKV adsorption and entry was monitored by comparing LEF-A addition 2 h before, together with, or 2 h after BKV infection. Supernatants were harvested at 72 h.p.i., and extracellular BKV loads were measured by qPCR as described. (B) LT-ag transcription was measured 24 and 48 h.p.i. Total RNA was extracted using the mirVana Paris kit (Ambion, Applied Biosystems) and treated with DNase turbo (Ambion, Applied Biosystems) before cDNA was generated from 225 ng RNA per sample using the High Capacity cDNA kit (Applied Biosystems). LT-ag transcripts were quantified by RT-qPCR and normalized to the levels of endogenous human hypoxanthine phosphoribosyltransferase (huHPRT) transcripts by the 2ΔΔC(T) method (5, 28). Results are presented as the changes in LT-ag transcript levels, with the level in the untreated sample 24 h.p.i. arbitrarily set to 100%. (C) LT-ag protein levels at 24 and 48 h.p.i. were examined by Western blotting. RPTECs were lysed in cell disruption buffer (mirVana Paris kit; Ambion), and Western blotting was performed as described previously (5) using polyclonal rabbit anti-LT-ag serum (20) and a monoclonal antibody directed against the housekeeping protein glyceraldehyde-3-phosphate dehydrogenase (GAPDH) (Abcam). The secondary antibodies used were IRDye800CW goat anti-rabbit IgG (Rockland) and Alexa Fluor 680 goat anti-mouse IgG (Invitrogen). (D) Early and late protein expression was investigated by indirect immunofluorescence staining. RPTECs were methanol fixed 24, 48, and 72 h.p.i., blocked with 3% goat serum in phosphate-buffered saline (PBS) for 30 min, and then treated as described earlier (27). The primary antibodies, SV40 LT-ag monoclonal (Pab416; Calbiochem) (red) and polyclonal rabbit anti-agnoprotein serum (20) (green), and the secondary antibodies, Alexa fluor 568 goat antimouse (Invitrogen) and Alexa fluor 488 goat antirabbit (Invitrogen), were used. Cell nuclei (blue) were stained with DRAQ5 (Biostatus). Images were collected using a Nikon TE2000 microscope equipped and processed with the NIS Elements Basic Research software program, version 2.2 (Nikon Corporation). (E) Intracellular BKV DNA loads were quantified from RPTECs harvested at 24, 48, and 72 h.p.i. After DNA extraction, BKV DNA loads were measured by qPCR and normalized for cellular DNA using the aspartoacylase (ACY) qPCR (5, 35, 36). Data are presented as Geq/cell. (F) Late protein expression was detected by Western blotting 48 h.p.i. as described above (5), using as primary antibodies polyclonal rabbit anti-VP1 serum (17), polyclonal rabbit anti-agnoprotein serum (20), and the monoclonal antibody directed against GAPDH (Abcam).
FIG. 2.
FIG. 2.
Influence of LEF-A on different steps in the BKV life cycle. RPTECs were seeded and infected as described earlier. (A) The influence of LEF-A on BKV adsorption and entry was monitored by comparing LEF-A addition 2 h before, together with, or 2 h after BKV infection. Supernatants were harvested at 72 h.p.i., and extracellular BKV loads were measured by qPCR as described. (B) LT-ag transcription was measured 24 and 48 h.p.i. Total RNA was extracted using the mirVana Paris kit (Ambion, Applied Biosystems) and treated with DNase turbo (Ambion, Applied Biosystems) before cDNA was generated from 225 ng RNA per sample using the High Capacity cDNA kit (Applied Biosystems). LT-ag transcripts were quantified by RT-qPCR and normalized to the levels of endogenous human hypoxanthine phosphoribosyltransferase (huHPRT) transcripts by the 2ΔΔC(T) method (5, 28). Results are presented as the changes in LT-ag transcript levels, with the level in the untreated sample 24 h.p.i. arbitrarily set to 100%. (C) LT-ag protein levels at 24 and 48 h.p.i. were examined by Western blotting. RPTECs were lysed in cell disruption buffer (mirVana Paris kit; Ambion), and Western blotting was performed as described previously (5) using polyclonal rabbit anti-LT-ag serum (20) and a monoclonal antibody directed against the housekeeping protein glyceraldehyde-3-phosphate dehydrogenase (GAPDH) (Abcam). The secondary antibodies used were IRDye800CW goat anti-rabbit IgG (Rockland) and Alexa Fluor 680 goat anti-mouse IgG (Invitrogen). (D) Early and late protein expression was investigated by indirect immunofluorescence staining. RPTECs were methanol fixed 24, 48, and 72 h.p.i., blocked with 3% goat serum in phosphate-buffered saline (PBS) for 30 min, and then treated as described earlier (27). The primary antibodies, SV40 LT-ag monoclonal (Pab416; Calbiochem) (red) and polyclonal rabbit anti-agnoprotein serum (20) (green), and the secondary antibodies, Alexa fluor 568 goat antimouse (Invitrogen) and Alexa fluor 488 goat antirabbit (Invitrogen), were used. Cell nuclei (blue) were stained with DRAQ5 (Biostatus). Images were collected using a Nikon TE2000 microscope equipped and processed with the NIS Elements Basic Research software program, version 2.2 (Nikon Corporation). (E) Intracellular BKV DNA loads were quantified from RPTECs harvested at 24, 48, and 72 h.p.i. After DNA extraction, BKV DNA loads were measured by qPCR and normalized for cellular DNA using the aspartoacylase (ACY) qPCR (5, 35, 36). Data are presented as Geq/cell. (F) Late protein expression was detected by Western blotting 48 h.p.i. as described above (5), using as primary antibodies polyclonal rabbit anti-VP1 serum (17), polyclonal rabbit anti-agnoprotein serum (20), and the monoclonal antibody directed against GAPDH (Abcam).
FIG. 3.
FIG. 3.
Influence of LEF-A on nuclear BKV replication architecture. (A) For confocal microscopy, RPTECs were seeded in fibronectin-coated chamber slides, infected, and treated with LEF-A (10 μg/ml) as described earlier. At 72 h.p.i., cells were fixed in 4% paraformaldehyde, followed by methanol permabilization and blocking with 3% goat serum in PBS for 30 min. Then, indirect immunofluorescence was performed as described earlier (27) using as primary antibodies an SV40 LT-ag monoclonal (Pab416; Calbiochem) (red) and polyclonal rabbit anti-VP1 serum (17) (green) and the secondary antibodies Alexa fluor 568 goat anti-mouse IgG (Invitrogen) and Alexa fluor 488 goat anti-rabbit IgG (Invitrogen). Cell nuclei (blue) were stained with DRAQ5 (Biostatus). Confocal microscopy analysis was performed using a microscope (Axiovert 200; Carl Zeis, Inc.) equipped with an LSM510 confocal module and processed using the LSM5 software program, version 3.2 (Carl Zeiss, Inc.). (B) For IEM analysis, RPTECs were grown in 6 wells, infected, and treated with LEF-A (10 μg/ml) as earlier described. At 48 h.p.i., cells were fixed with 4% formaldehyde, washed in 0.12% glycin, scraped off, and pelleted in 12% gelatin. The pellet was placed in 2.3 M sucrose overnight, cut in cubes, mounted on cryo-pins, frozen by immersion in liquid nitrogen, and sectioned using a Leica EM UC6 ultramicrotome. The sections were submerged in 1% cold-water fish skin gelatin overnight and incubated with polyclonal rabbit anti-VP1 serum (17) and then with protein A-gold (10 nm). The specimens were contrasted with a mixture of uranyl acetate and methylcellulose and examined by using a Jeol 1010 transmission electron microscope.
FIG. 4.
FIG. 4.
Impact of uridine on BKV replication and cellular viability in LEF-A-treated RPTECs. RPTECs were seeded and infected as earlier described. At 2 h.p.i., virus was removed and replaced with LEF-A-containing medium with or without exogenous uridine at 100 μM. For intracellular DNA measurements, cells were harvested 48 h.p.i., and for extracellular BKV load, supernatants were harvested 72 h.p.i. BKV and cellular DNA loads were measured by qPCR as described earlier, and BKV loads of untreated cells were set as 100%. In addition, RPTEC cellular DNA replication was measured by cell proliferation ELISA, BrdU, and total cellular metabolic activity determined using TOX-8 at 48 h.p.i. as described earlier. Absorbance for untreated cells was set as 100%.

Similar articles

Cited by

References

    1. Awdishu, L., E. Sonbol, A. Feist, F. Lin, O. Alemi, R. Huang, and R. Pharmacy. 2009. Leflunomide delays recovery in kidney transplant recipients with BK viremia. American Transplant Congress 2009, abstr. L 503.
    1. Bansal, S., M. S. Lucia, and A. Wiseman. 2008. A case of polyomavirus-associated nephropathy presenting late after transplantation. Nat. Clin. Pract. Nephrol. 4:283-287. - PubMed
    1. Basse, G., C. Mengelle, N. Kamar, J. Guitard, D. Ribes, L. Esposito, and L. Rostaing. 2007. Prospective evaluation of BK virus DNAemia in renal transplant patients and their transplant outcome. Transplant. Proc. 39:84-87. - PubMed
    1. Baumann, P., S. Mandl-Weber, A. Volkl, C. Adam, I. Bumeder, F. Oduncu, and R. Schmidmaier. 2009. Dihydroorotate dehydrogenase inhibitor A771726 (leflunomide) induces apoptosis and diminishes proliferation of multiple myeloma cells. Mol. Cancer Ther. 8:366-375. - PubMed
    1. Bernhoff, E., T. J. Gutteberg, K. Sandvik, H. H. Hirsch, and C. H. Rinaldo. 2008. Cidofovir inhibits polyomavirus BK replication in human renal tubular cells downstream of viral early gene expression. Am. J. Transplant. 8:1413-1422. - PubMed

Publication types

MeSH terms