. 2009 Dec 2;29(48):15053-62.
doi: 10.1523/JNEUROSCI.3011-09.2009.

Trial-to-trial variability of single cells in motor cortices is dynamically modified during visuomotor adaptation

Affiliations

Trial-to-trial variability of single cells in motor cortices is dynamically modified during visuomotor adaptation

Yael Mandelblat-Cerf et al. J Neurosci. .

Abstract

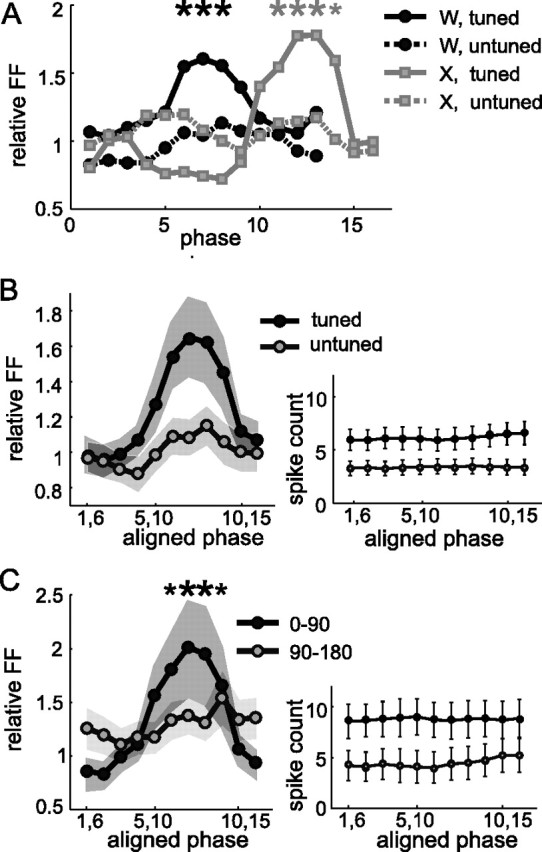
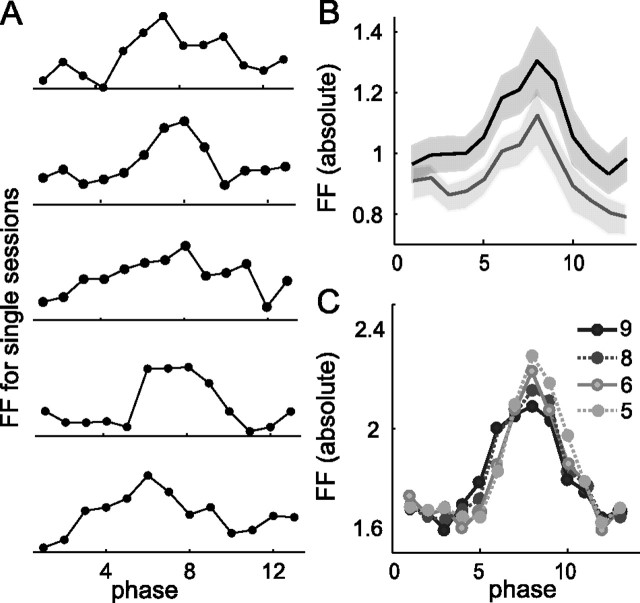
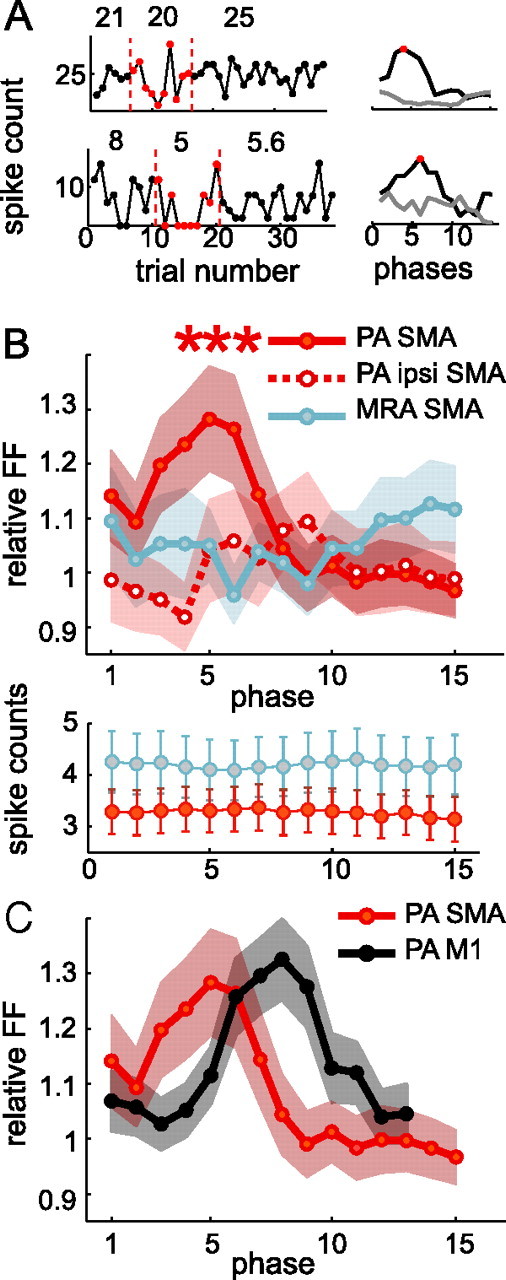
Neurons in all brain areas exhibit variability in their spiking activity. Although part of this variability can be considered as noise that is detrimental to information processing, recent findings indicate that variability can also be beneficial. In particular, it was suggested that variability in the motor system allows for exploration of possible motor states and therefore can facilitate learning and adaptation to new environments. Here, we provide evidence to support this idea by analyzing the variability of neurons in the primary motor cortex (M1) and in the supplementary motor area (SMA-proper) of monkeys adapting to new rotational visuomotor tasks. We found that trial-to-trial variability increased during learning and exhibited four main characteristics: (1) modulation occurred preferentially during a delay period when the target of movement was already known, but before movement onset; (2) variability returned to its initial levels toward the end of learning; (3) the increase in variability was more apparent in cells with preferred movement directions close to those experienced during learning; and (4) the increase in variability emerged at early phases of learning in the SMA, whereas in M1 behavior reached plateau levels of performance. These results are highly consistent with previous findings that showed similar trends in variability across a population of neurons. Together, the results strengthen the idea that single-cell variability can be much more than mere noise and may be an integral part of the underlying mechanism of sensorimotor learning.


Conflict of interest statement

The authors declare no competing financial interests.

Figures

Figure 1.
Figure 1.
Experimental design. A, Single-trial flow (first row, from left to right) and session flow (second row). During period HOLD1, the monkey held the manipulandum in the center (origin) without moving it. The monkey kept holding at the origin after TO for an additional delay (hold2) and moved after the go signal. Shown (rightmost design) is a learning trial with a rotation of 90°. The red line shows arm movement (the LD), and the green line shows the resulting cursor movement. B, Session flow. Each day (session) consisted of three different epochs, with standard trials prelearning and postlearning. For details of the experimental design, see the study by Paz et al. (2003).
Figure 2.
Figure 2.
Typical dynamics of averaged FFs of M1 cells is temporally correlated to learning dynamics, shown for monkey X (black; Ncells = 25) and monkey W (gray; Ncells = 114). A, The average of relative FFs over all cells shows significant modulation of PA (left trace) but not of MRA (right trace). Parallel lines denote averaged bootstrap results for FF of PA for each monkey with corresponding colors. Big and small asterisks denote significant difference from chance of 5% and 1%, respectively. B, Behavioral improvement during learning. Performance is expressed by averaged SND over all trials of each phase. Note that monkey X was a slow learner and monkey W was much faster. Comparing the graphs in A and B shows the temporal relationship between behavioral improvement and FF increase. C, Comparison of averaged FF dynamics during learning recorded contralateral (con-lat.) to hand movement (monkey W, solid black line, same data as in A) to FF dynamics during ipsilateral (ipsi-lat.) recordings, averaged over n = 107 cells (dashed black line with white circles). Parallel solid and dashed lines denote averaged bootstrap results for the contralateral and ipsilateral conditions, respectively. Note that here FF is given in absolute values. D, Behavioral performance during repetition of movements to the same direction without visuomotor rotation. Performance is expressed by angular error at peak velocity averaged over all trials of each phase. Since there is no rotation, the angular error is not normalized as in B above. Note that as expected, no improvement in performance is evident. E, Average FFs across cells recorded during repetition sessions (rep.; Ncells = 39) shows no modulation along phases.
Figure 3.
Figure 3.
Averaged FFs (top row) and PETHs (bottom row) during epochs around (A) TO and (B) MO for phases 3, 8, and 13. No difference between the phases was found around MO for either PETHs or FFs (right column). Around TO, PETHs did not show any difference between the phases, whereas FFs of phase 8 after TO deviated significantly above phases 3 and 13 (left column, bottom row). The blue dashed line marks the time of event occurrence, and black lines mark the time windows of PA and MRA, as defined in this work. Big and small asterisks denote significant difference from chance of 5% and 1%, respectively.
Figure 4.
Figure 4.
FF modulations of M1 single cells. A, First and second rows show raster plots around TO and MO, respectively. Spike counts in the windows of PA and MRA for each trial are denoted on the right. B, FFs along the phases for PA (black) and MRA (gray). Phase 8 is highlighted by red markers both for PA and MRA computations; dashed red lines indicate the bounds of phase 8 in the PETHs, and red circles indicate their corresponding spike counts and FF. Averaged spike counts before, in, and after phase 8 are denoted. Black and blue lines are as in Figure 3. C, D, Activity modulations in two other cells top and bottom rows). C, Spike counts of PA along learning trials. D, FFs along phases for PA and MRA. Markers are as before. SpC, Spike count.
Figure 5.
Figure 5.
FF typical dynamics emerge primarily in directionally tuned cells with a PD close to the LD. A, FF dynamics for monkey W (black, circle) and monkey X (gray, square), split into tuned (solid lines) and untuned (dotted lines) cells. Tuned cells (monkey W, Ncells = 17; monkey X, Ncells = 7) show the typical dynamics, whereas untuned do not. B, Left, Alignment of both monkeys' FF dynamics to pool their cells. Aligned phases are denoted for monkeys W and X. Right, Spike counts for tuned and untuned cells. C, Left, Division of tuned cells according to distance of the cell's PD from the LD. Cells with PD <90° away from the LD (Ncells = 9) showed the typical FF modulation. Right, Spike counts for closely and distantly tuned cells. Apparently, FF typical dynamics cannot be explained by changes in spike counts. Big and small asterisks denote significant difference from chance of 5% and 1%, respectively.
Figure 6.
Figure 6.
FF typical dynamics emerged under several control conditions (Ncells = 114, all from monkey W). A, Single sessions. Each trace corresponds to a single session, showing the averaged FFs of tuned cells recorded along it. B, Eliminating, for each phase, the maximal and minimal spike counts (black) or those two that deviated most from the average (gray). In both cases, FF modulation remained significant, suggesting it did not result from mere outliers. C, FF computations for five, six, eight, or nine trials (from light to dark shades of gray) in a phase. All show the typical FF modulation.
Figure 7.
Figure 7.
FF analysis in the SMA (Ncells = 78) shows the typical dynamics of PA that temporally precede that in M1. A, Activity modulations in two SMA cells. Spike counts of PA along learning trials (left) and FFs along phases for PA (black) and MRA (gray). For each cell, spike counts of the phase with maximal FF of PA are marked by red circles and bounded by two dashed red lines. FFs of PA and MRA in this phase are also marked by red circles. Asterisks denote 1% significant difference from chance. B, Top row, Relative FFs averaged across cells for PA in SMA cells recorded contralateral to the moving hand display the typical dynamics (solid red), whereas ipsilateral cells did not (dashed red line). FFs for MRA did not show the dynamics either (blue). Bottom row, Averaged spike counts for PA (red) and MRA (blue) for contralateral SMA cells showed no modulation. C, FF for PA in SMA (red) and M1 (black) showing that the typical dynamics in SMA preceded M1.

References

    1. Abeele S, Bock O. Mechanisms for sensorimotor adaptation to rotated visual input. Exp Brain Res. 2001;139:248–253. - PubMed
    1. Andersen RA, Buneo CA. Intentional maps in posterior parietal cortex. Annu Rev Neurosci. 2002;25:189–220. - PubMed
    1. Arieli A, Sterkin A, Grinvald A, Aertsen A. Dynamics of ongoing activity: explanation of the large variability in evoked cortical responses. Science. 1996a;273:1868–1871. - PubMed
    1. Arieli A, Sterkin A, Grinvald A, Aertsen A. Rehovot: The Grodetsky Center for Research of Higher Brain Functions; 1996b. Predicting cortical evoked responses in spite of their large variability—the impact of ongoing activity.
    1. Bach M, Kruger J. Correlated neuronal variability in monkey visual cortex revealed by a multi-microelectrode. Exp Brain Res. 1986;61:451–456. - PubMed

Publication types

LinkOut - more resources