. 2009 Dec 2;29(48):15213-22.
doi: 10.1523/JNEUROSCI.4296-09.2009.

Subthreshold activation of the superior colliculus drives saccade motor learning

Affiliations

Subthreshold activation of the superior colliculus drives saccade motor learning

Robijanto Soetedjo et al. J Neurosci. .

Abstract

How the brain learns and maintains accurate precision movements is currently unknown. At times throughout life, rapid gaze shifts (saccades) become inaccurate, but the brain makes gradual adjustments so they again stop on target. Previously, we showed that complex spikes (CSs) in Purkinje cells of the oculomotor cerebellum report the direction and amplitude by which saccades are in error. Anatomical studies indicate that this error signal could originate in the superior colliculus (SC). Here, we deliver subthreshold electrical stimulation of the SC after the saccade lands to signal an apparent error. The size of saccades in the same direction as the simulated error gradually increase; those in the opposite direction decrease. The electrically adapted saccades endure after stimulation is discontinued, exhibit an adaptation field, can undergo changes in direction, and depend on error timing. These electrically induced adaptations were virtually identical with those produced by the visually induced adaptations that we report here for comparable visual errors in the same monkeys. Therefore, our experiments reveal that an additional role for the SC in the generation of saccades is to provide a vector error signal that drives dysmetric saccades to adapt. Moreover, the characteristics of the electrically induced adaptation reflect those of error-related CS activity in the oculomotor cerebellum, suggesting that CS activity serves as the learning signal. We speculate that CS activity may serve as the error signal that drives other kinds of motor learning as well.


Figures

Figure 1.
Figure 1.
Methods to induce electrically and visually induced adaptation. A, For electrically induced adaptation, occurrence of a targeting saccade extinguished the target for 700 ms (dashed line) and a subthreshold stimulus train (thin black lines) was delivered δ ms after the end of each saccade. The position of the extinguished target was clamped to the position of the eye (gray traces) at the end of each saccade. B, For visually induced adaptation, occurrence of a targeting saccade extinguished the target until the end of the saccade (dashed line). Then the target was illuminated at a fixed offset (constant error) from the eye position (gray traces) at the end of the saccade, either forward to produce an amplitude increase (top traces) or backward to produce an amplitude decrease (bottom traces).
Figure 2.
Figure 2.
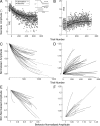
Comparison between electrically induced and visually induced adaptation. A, B, Saccade amplitude as a function of sequential trial number during electrically induced (circles) and error vector matched visually induced (gray dots) adaptations. Suprathreshold stimulation at this SC site evoked saccades of 2.6° amplitude at an angle of 150° (A, inset; thick curves are mean eye positions), which we consider to be an estimate of the putative error vector. We produced stimulus-induced adaptation with a subthreshold stimulus train (200 Hz; 100 ms; 11 μA) beginning 80 ms after the saccade landed. Saccades to 15° target steps in the opposite direction (A) decreased their amplitudes; those in the same direction (B) increased their amplitudes. Exponential fits for the electrically and visually induced adaptations are solid and dashed, respectively. Here and in Figures 3 and 7, data before trial number zero (PRE) were collected before adaptation. C, D, For all neurons, similar fits of amplitude decrease (C) and increase (D) adaptations induced either by an electrical (solid curves) or visual stimulus (dashed curves). Each fit is normalized to start at 1 by dividing all saccade amplitudes during adaptation by the value of the fit at trial 1. E, F, Fits of electrically induced adaptations (C, D, solid curves) versus those of error-matched visually induced adaptations (C, D, dashed curves), plotted only up to the smaller number of trials in the pair. A pair of adaptations with identical time courses would yield a line with a slope of −1 or 1 (black lines) for an amplitude decrease (E) or increase (F), respectively.
Figure 3.
Figure 3.
Saccade adaptation produced by stimulation at different SC sites. A, B, Courses of amplitude decrease (A) and increase (B) adaptation induced by stimulation of 7.6° (triangles) and 1.1° (circles) error sites in separate experiments. Three fits are exponential and one is linear. C, D, Log percentage amplitude decrease or increase, respectively, caused by electrically induced (open circles) and visually induced adaptation (dots) as a function of log error size. Logs are used because the distribution of error sizes was skewed toward large errors. Percentage amplitude decrease was computed after 373 trials. Percentage amplitude increase was computed after 270 trials, except in four experiments (D, gray circle and dots) for which trials ranged from 206 to 246. In C, the solid line is the linear regression of the stimulation data (r = 0.76; n = 18); the regression was not significantly different after the largest error size datum (17.2°) was removed (dashed line). In D, § identifies percentage amplitude increases that were not significantly different from zero (p > 0.05, two-tailed Student's t test).
Figure 4.
Figure 4.
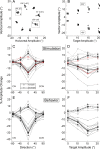
Electrically and visually induced adaptation fields. A, B, Vertical and horizontal components of saccades in eight directions (A) and vector saccade amplitudes to four target step sizes (B) before (gray) and after (black) stimulus-induced adaptation. C, D, Percentage amplitude change as a function of saccade direction and amplitude after electrically induced adaptation (gray). Adapted direction is normalized to 0°. For amplitude decreases, a median −16.14% amplitude change in the adapted direction (C, heavy circle at 0°) caused −4.25 and −3.71% amplitude changes at ±45°; a median −12.9% change at the adapted amplitude (15°) caused −11 and −7.3% changes of saccades to 20 and 10° target steps (D). For amplitude increases, a median +12.21% amplitude change in the adapted direction caused no significant change at ±45° (C); a median +9.1% change at the adapted amplitude caused +7.3 and +3.7% changes of saccades to 20 and 10° target steps (D). E, F, Visually induced adaptation fields. For amplitude decreases, a median −30.31% amplitude change in the adapted direction caused −9.37 and −8.1% changes at ±45°, and −2.15 and −1.7% at ± 90° (E); a median −27.1% adapted amplitude change caused −7.75, −14.1, and −21.5% changes of saccades to 5, 10, and 20° target steps, respectively (F). For amplitude increases, a median +8.56% amplitude change in the adapted direction produced 0 and +3.3% changes at ±45°(E); a median +9.1% change at the adapted amplitude caused +3.24 and +8% changes of saccades to 10 and 20° target steps (F). The asterisks indicate significant changes (p < 0.05, Wilcoxon–Mann–Whitney test).
Figure 5.
Figure 5.
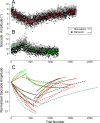
Courses of recovery of electrically induced and visually induced adaptation. A, B, Saccade amplitude versus sequential trial number during electrically induced (gray symbols, solid fits) and error vector matched visually induced (black dots, dashed fits) adaptation followed by recovery. C, Summary of seven exponential fits of normalized amplitude as a function of trial number during either electrically induced (solid lines) or error vector-matched (same color) visually induced (dashed lines) adaptation and recovery. Both adaptation and recovery fits were normalized with respect to the value of the fit at trial 1. The smaller number of amplitude increase trials was a result of the ±20° limitation in eye position eccentricity.
Figure 6.
Figure 6.
Cross-axis adaptation. A, B, Direction angles of upward (A) and downward (B) saccades as a function of sequential trial number during electrically induced (circles, solid fits) and visually induced (gray squares, dashed fits) adaptations using 1° leftward errors. Both upward and downward saccades gradually acquired leftward components that increased and decreased their angles, respectively. C, D, X–Y plots of 20 saccade trajectories at the beginning (A, B, gray trajectories from gray rectangles) and toward the end (pink trajectories from pink rectangles) of adaptation. E, Linear or exponential fits of angular direction change as a function of sequential trial number for six stimulation (solid curves) and four matched (same colors) behavioral (dashed curves) adaptations. Starting angles are normalized to 0°. F, Electrically induced change of angle as a function of vector error matched visually induced change of angle for the same number of trials (red curves, angle decrease; green curves, angle increase). Data with identical courses would lie on the line of slope 1 (black).
Figure 7.
Figure 7.
Effect of stimulus delay on adaptation. A, B, Saccade amplitude as a function of sequential trial number for three different experiments. In A and B, the electrically induced error vector should have produced a decrease and increase, respectively, in saccade amplitude. The stimulus delay began 600 ms after each saccade (inset, gray dots and curves from 0 to ∼300–400 trials) and then was switched to 80 ms (inset, black dots, and curves). The red curves are fits of raw amplitude data (dots) of one of the three experiments. The green and blue curves are fits from the other two experiments (raw data not shown). Fits are either linear or exponential. To compare fits across three experiments, all fits are normalized to the fitted amplitude of trial 1 (right scales). C, Percentage amplitude changes (Δ) produced by the later 80 ms versus the earlier 0, 200, 400, or 600 ms delays of all 12 experiments like those in A and B. For amplitude decreases and increases, changes were measured after 373 and 262 trials (Eq. 1), respectively. Nonsignificant differences lie near the line of slope 1.0 (filled symbols, p > 0.05, two-tailed Student's t test). D, Comparison of percentage amplitude changes produced by 0, 80, 200, 400, and 600 ms stimulus delays for both amplitude increase (circles) and decrease (squares) adaptation. For each delay, there were three experiments with the same primary saccade size (10°) and comparable error vector sizes (range, 0.6–3.5°; mean, 2.3 ± 0.87°). The red and green symbols are mean percentage amplitude changes of the three experiments within the same delay bin. The asterisks identify percentage amplitude changes that are significantly different from zero (p < 0.05, one-sample two-tailed Student's t test). Error bars indicate SD.

References

    1. Abzug C, Maeda M, Peterson BW, Wilson VJ. Cervical branching of lumbar vestibulospinal axons. J Physiol. 1974;243:499–522. - PMC - PubMed
    1. Albus JA. A theory of cerebellar function. Math Biosci. 1971;10:25–61.
    1. Anderson RW, Keller EL, Gandhi NJ, Das S. Two-dimensional saccade-related population activity in superior colliculus in monkey. J Neurophysiol. 1998;80:798–817. - PubMed
    1. Barash S, Melikyan A, Sivakov A, Zhang M, Glickstein M, Thier P. Saccadic dysmetria and adaptation after lesions of the cerebellar cortex. J Neurosci. 1999;19:10931–10939. - PMC - PubMed
    1. Carey MR, Medina JF, Lisberger SG. Instructive signals for motor learning from visual cortical area MT. Nat Neurosci. 2005;8:813–819. - PMC - PubMed

Publication types