. 2009 Dec 2;29(48):15223-31.
doi: 10.1523/JNEUROSCI.3252-09.2009.

One-year brain atrophy evident in healthy aging

Affiliations

One-year brain atrophy evident in healthy aging

Anders M Fjell et al. J Neurosci. .

Abstract

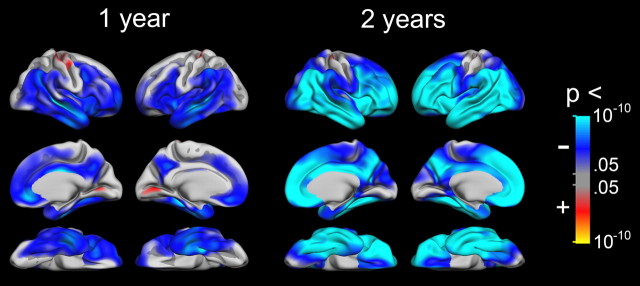
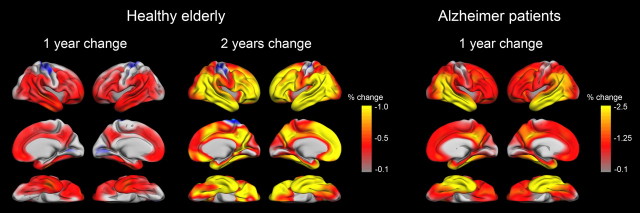
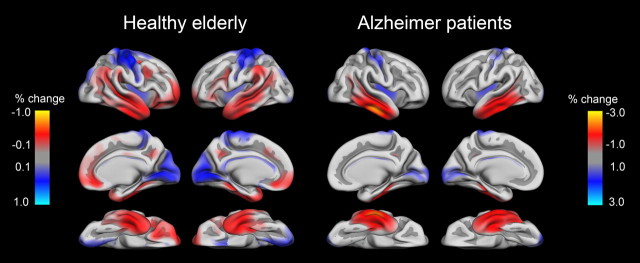
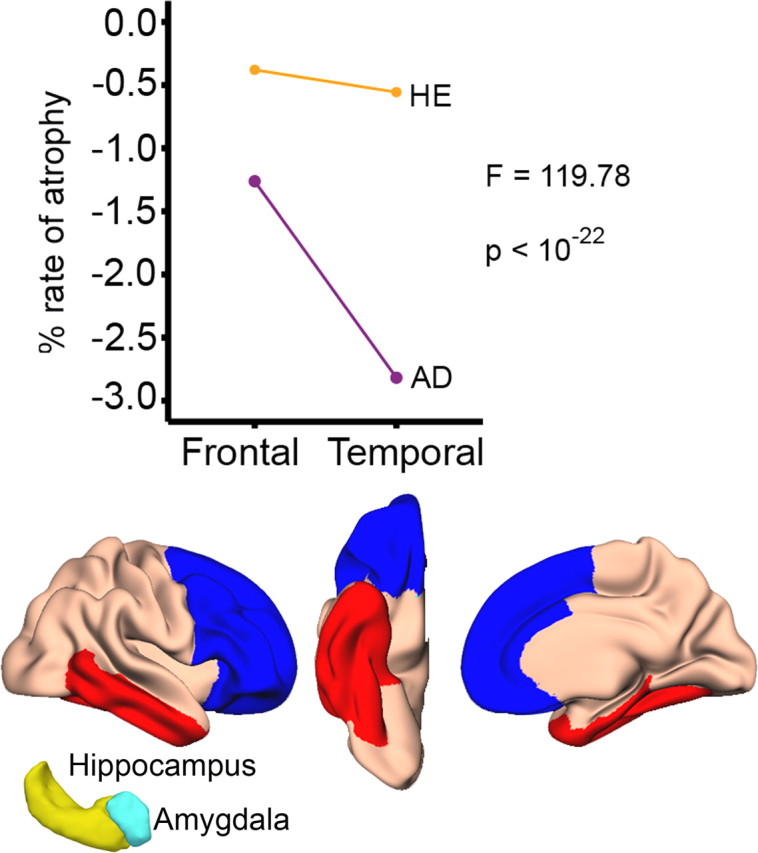
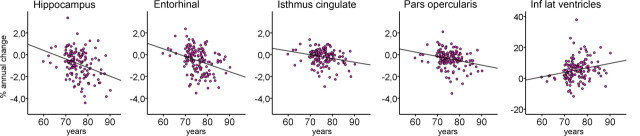
An accurate description of changes in the brain in healthy aging is needed to understand the basis of age-related changes in cognitive function. Cross-sectional magnetic resonance imaging (MRI) studies suggest thinning of the cerebral cortex, volumetric reductions of most subcortical structures, and ventricular expansion. However, there is a paucity of detailed longitudinal studies to support the cross-sectional findings. In the present study, 142 healthy elderly participants (60-91 years of age) were followed with repeated MRI, and were compared with 122 patients with mild to moderate Alzheimer's disease (AD). Volume changes were measured across the entire cortex and in 48 regions of interest. Cortical reductions in the healthy elderly were extensive after only 1 year, especially evident in temporal and prefrontal cortices, where annual decline was approximately 0.5%. All subcortical and ventricular regions except caudate nucleus and the fourth ventricle changed significantly over 1 year. Some of the atrophy occurred in areas vulnerable to AD, while other changes were observed in areas less characteristic of the disease in early stages. This suggests that the changes are not primarily driven by degenerative processes associated with AD, although it is likely that preclinical changes associated with AD are superposed on changes due to normal aging in some subjects, especially in the temporal lobes. Finally, atrophy was found to accelerate with increasing age, and this was especially prominent in areas vulnerable to AD. Thus, it is possible that the accelerating atrophy with increasing age is due to preclinical AD.


Figures

Figure 1.
Figure 1.
Cortical atrophy in healthy elderly. General linear models were used to test whether rates of atrophy for 1 and 2 years were significantly different from zero. The results were thresholded by a conventional criterion for correction for multiple comparisons (false discovery rate <0.05) and projected onto a semi-inflated template brain. Blue-cyan areas indicate cortical reduction, while red-yellow areas indicate expansion. As can be seen, significant volume reductions are found across large areas already after 1 year, and these were especially prominent in temporal and prefrontal areas.
Figure 2.
Figure 2.
Rate of change in healthy elderly and AD patients. The left panel shows annual longitudinal atrophy in healthy elderly calculated as percentage volume change relative to baseline, while the middle panel shows longitudinal atrophy over 2 years. Annual change of ∼0.5% can be seen across large sections of the brain surface, e.g., in temporal and prefrontal areas. The right panel shows 1 year atrophy in AD patients. The areas of change in the healthy elderly are overlapping with areas most strongly affected in Alzheimer's disease, e.g., temporal lobe cortex. However, areas that are not especially affected in AD, e.g., prefrontal cortex, also undergo large changes in healthy aging. Please note that to allow optimal visualization of regional variation, the color scale is different for the healthy elderly and the AD groups.
Figure 3.
Figure 3.
Regional rates of atrophy relative to mean atrophy within group for healthy elderly and AD. To visualize the areas that showed more than average atrophy and the areas that showed less than average atrophy within each group, mean cortical volume reduction was calculated for each hemisphere in each group. This value was subtracted from the surface maps, yielding a new map highlighting areas that show greater (red) and lesser (blue) rates of atrophy than average for that group. As can be seen, in healthy elderly (left), higher than average volume reductions are seen in lateral temporal, inferior parietal, supramarginal, and frontal cortices. In contrast, the AD patients show higher than average atrophy mainly in the temporal lobe (middle and inferior temporal gyri, fusiform gyrus). Please note that to allow optimal visualization of regional variation, the color scale is different for the healthy elderly and the AD groups.
Figure 4.
Figure 4.
Frontal versus temporal effects of healthy aging and Alzheimer's disease. The line graphs show rate of atrophy for the frontal and the temporal regions in healthy elderly and AD patients. The regions are shown below (blue: frontal, red: temporal). In addition to the cortical areas shown, hippocampus and amygdala were included in the temporal region (yellow and cyan 3D figures). ANOVA showed a significant interaction between group and region: While the AD patients showed more atrophy in the temporal (−2.82%, SE = 0.14) than the frontal regions (−1.26%, SE = 0.11), the rate of atrophy between these two regions was comparable in the healthy controls (temporal: −0.56%, SE = 0.07/frontal: −0.38%, SE = 0.07).
Figure 5.
Figure 5.
Relationships between age and rate of atrophy in healthy elderly. Scatter plots for selected ROIs showing the relationship between age and rates of annual volumetric reductions.

References

    1. Allen JS, Bruss J, Brown CK, Damasio H. Normal neuroanatomical variation due to age: the major lobes and a parcellation of the temporal region. Neurobiol Aging. 2005;26:1245–1260. discussion 1279–1282. - PubMed
    1. Ashburner J, Andersson JL, Friston KJ. High-dimensional image registration using symmetric priors. Neuroimage. 1999;9:619–628. - PubMed
    1. Barnes J, Bartlett JW, van de Pol LA, Loy CT, Scahill RI, Frost C, Thompson P, Fox NC. A meta-analysis of hippocampal atrophy rates in Alzheimer's disease. Neurobiol Aging. 2009;30:1711–1723. - PMC - PubMed
    1. Buckner RL, Snyder AZ, Shannon BJ, LaRossa G, Sachs R, Fotenos AF, Sheline YI, Klunk WE, Mathis CA, Morris JC, Mintun MA. Molecular, structural, and functional characterization of Alzheimer's disease: evidence for a relationship between default activity, amyloid, and memory. J Neurosci. 2005;25:7709–7717. - PMC - PubMed
    1. Burgmans S, van Boxtel MP, Smeets F, Vuurman EF, Gronenschild EH, Verhey FR, Uylings HB, Jolles J. Prefrontal cortex atrophy predicts dementia over a six-year period. Neurobiol Aging. 2009a;30:1413–1419. - PubMed

Publication types