. 2009 Dec 2;29(48):15245-57.
doi: 10.1523/JNEUROSCI.3606-09.2009.

Interneurons produced in adulthood are required for the normal functioning of the olfactory bulb network and for the execution of selected olfactory behaviors

Affiliations

Interneurons produced in adulthood are required for the normal functioning of the olfactory bulb network and for the execution of selected olfactory behaviors

Vincent Breton-Provencher et al. J Neurosci. .

Abstract

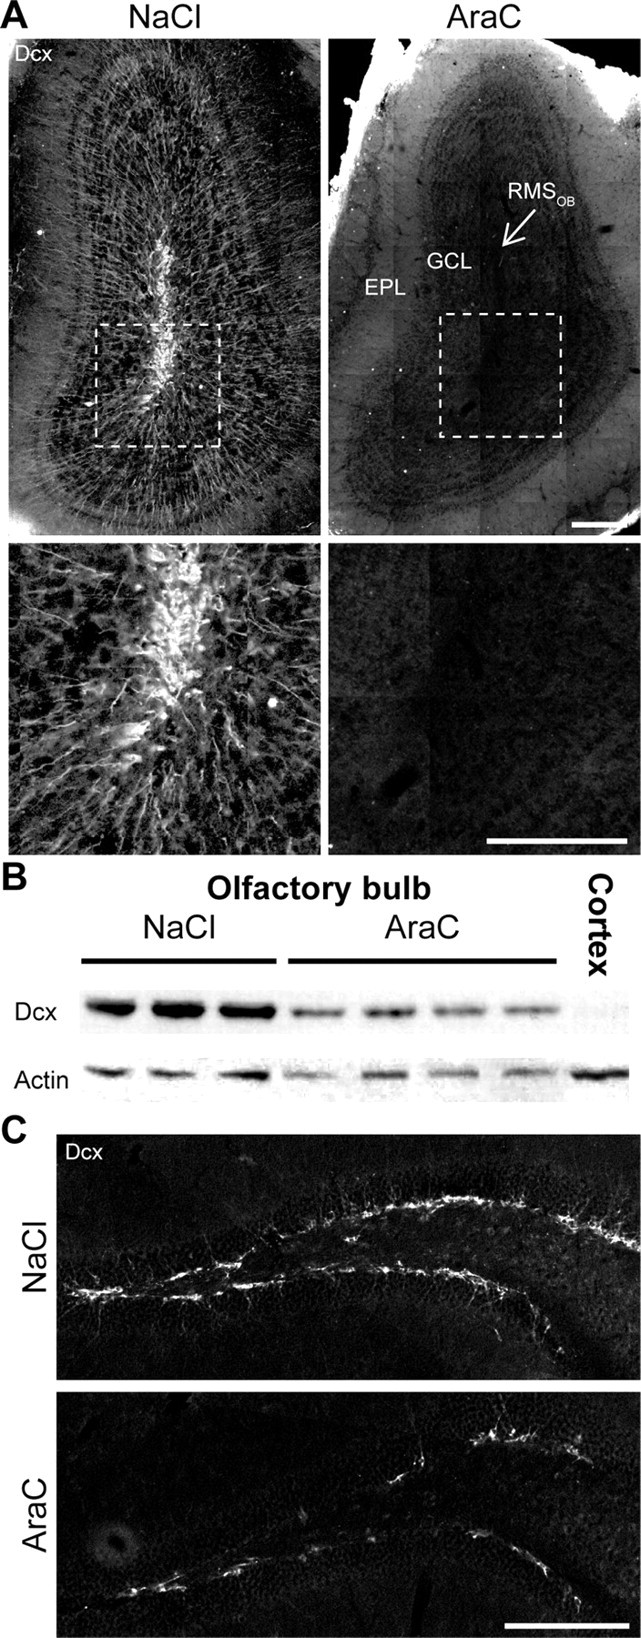
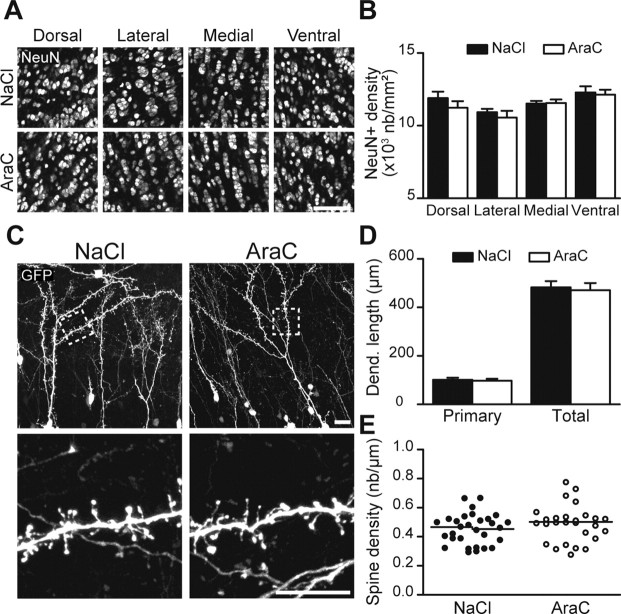
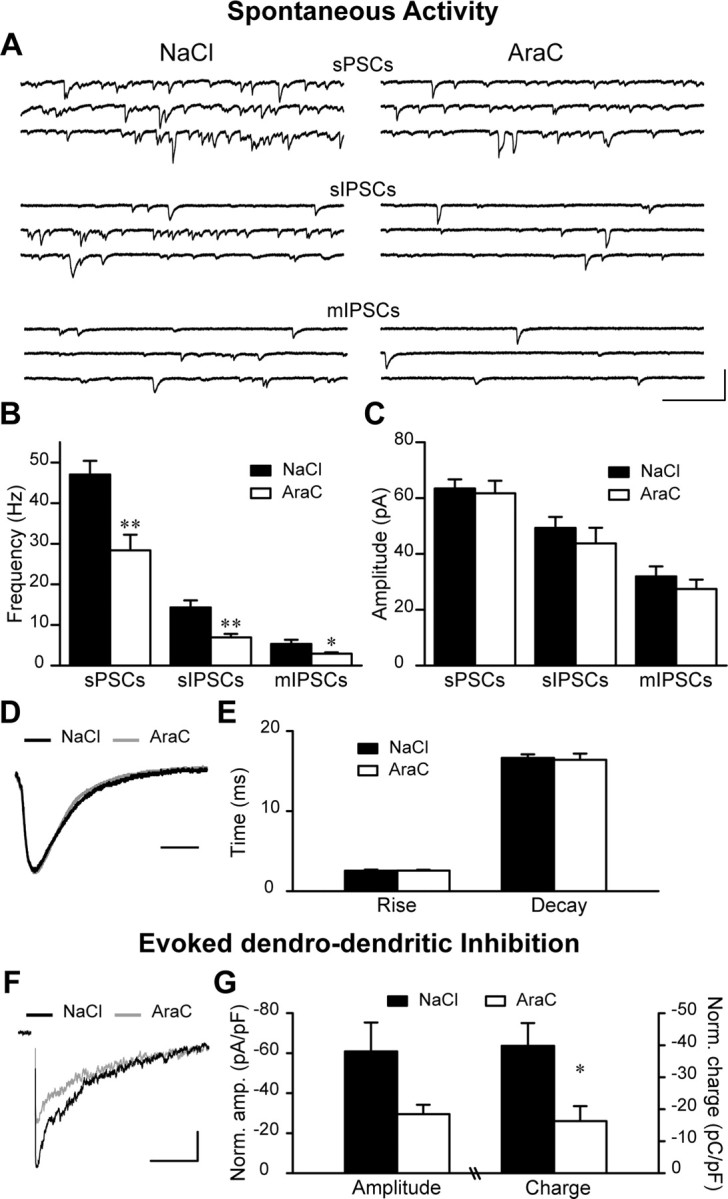
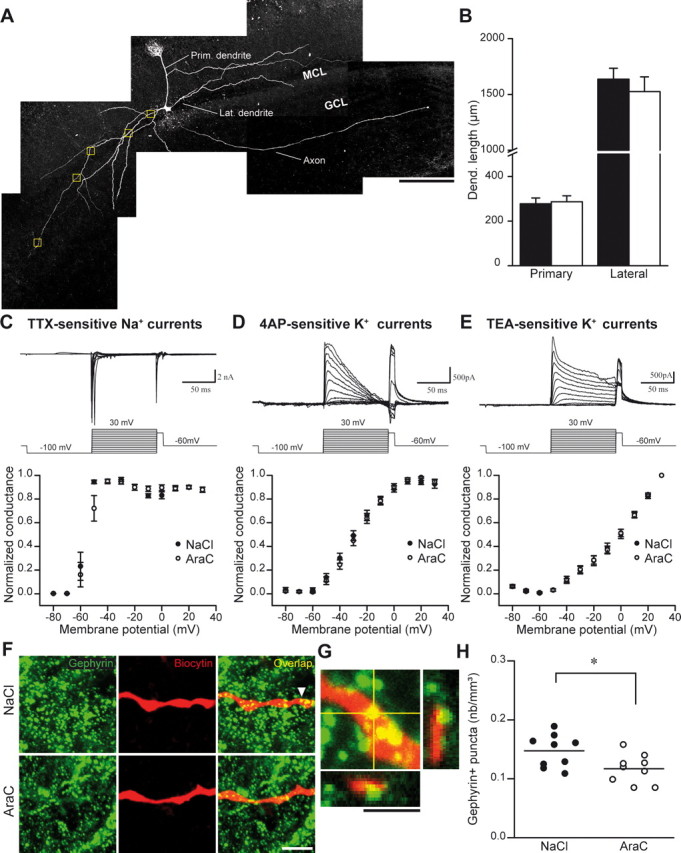
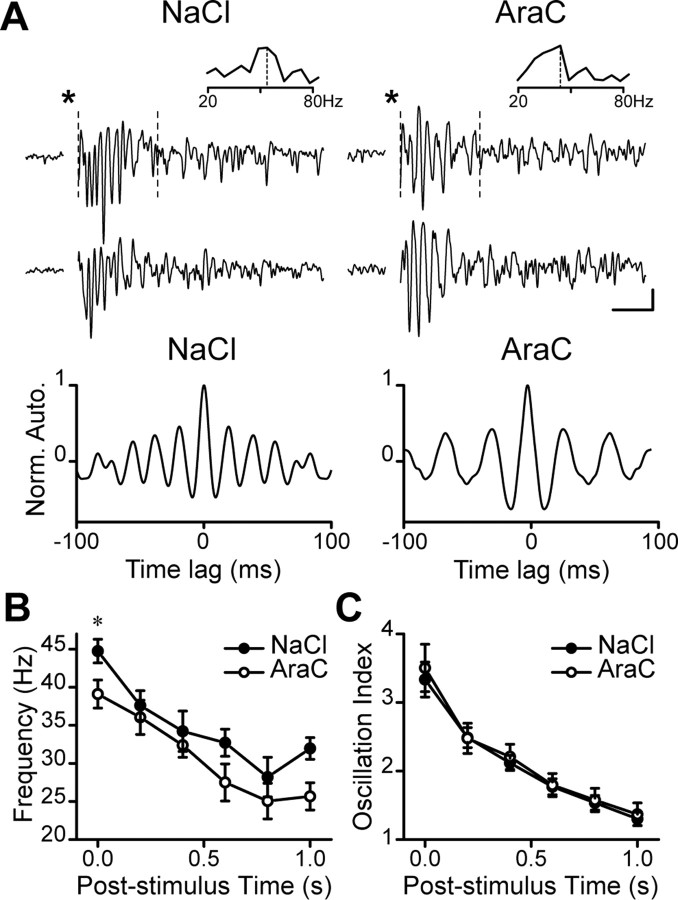
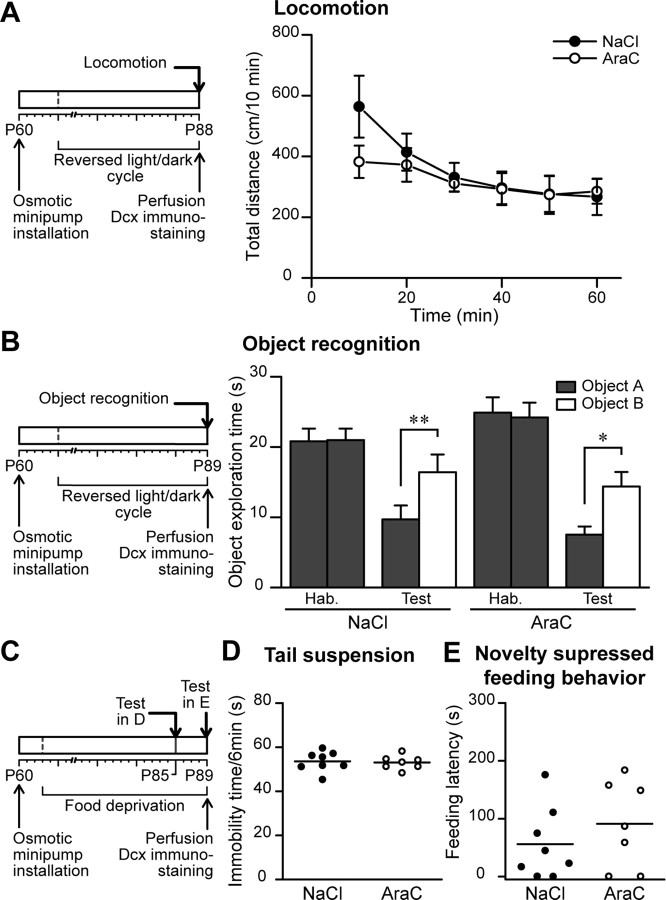
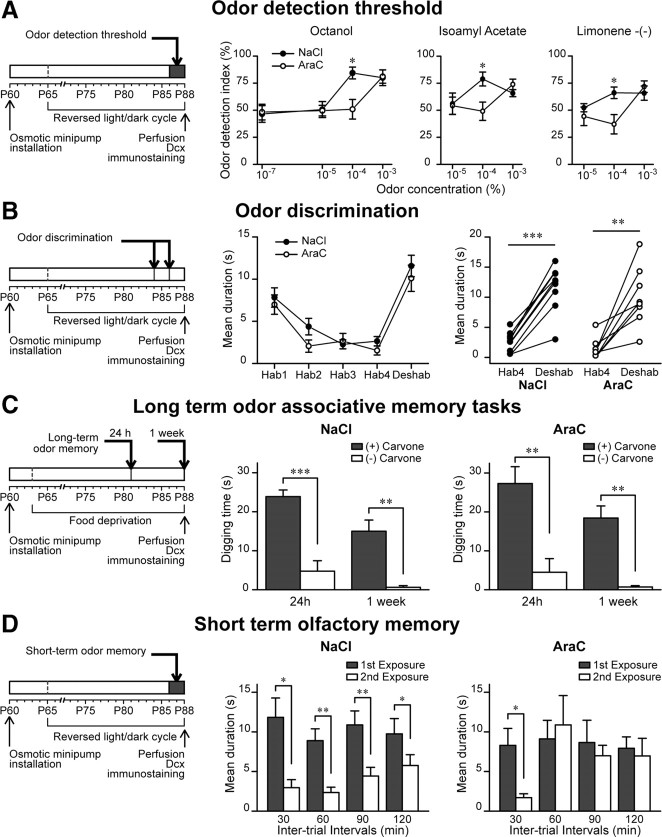
Olfactory bulb (OB) interneurons are continuously renewed throughout an animal's lifespan. Despite extensive investigation of this phenomenon, little is known about bulbar circuitry functioning and olfactory performances under conditions of ablated arrival of new neurons into the adult OB. To address this issue we performed morphological, electrophysiological, and behavioral analysis in mice with suppressed bulbar neurogenesis. Infusion of the antimitotic drug AraC to the lateral ventricle via 28 d osmotic minipumps abolished the arrival of newly born neurons into the adult OB without affecting the total number of granule cells. The number, dendritic arborization, and spine density of interneurons generated in adulthood, before pump installation, were also not affected by AraC treatment. As a result of ablated neurogenesis, mitral cells--the principal output neurons in the OB--receive fewer inhibitory synapses, display reduced frequency of spontaneous IPSCs, experience smaller dendrodendritic inhibition, and exhibit decreased synchronized activity. Consequently, short-term olfactory memory was drastically reduced in AraC-treated mice. In contrast, olfactory performances of AraC-treated animals were undistinguishable from those of control mice in other odor-associated tests, such as spontaneous odor discrimination and long-term odor-associative memory tasks. Altogether, our data highlight the importance of adult neurogenesis for the proper functioning of the OB network and imply that new bulbar interneurons are involved in some, but not all, odor-associated tasks.


Figures

Figure 1.
Figure 1.
Infusion of antimitotic drug, AraC, abolishes neurogenesis in the adult olfactory bulb but not in the hippocampus. A, Top, Immunostaining for Dcx in coronal sections of the OB of control (NaCl) and AraC-treated animals. Note the absence of immunofluorescence in the rostral migratory stream of the OB (RMSOB) and the granular cell layer (GCL) in the AraC-treated mouse. EPL, External plexiform layer. Bottom, Enlarged view of boxed regions. B, Western blot analysis of OBs samples showing a drastic reduction of Dcx following a 28 d AraC infusion into the lateral ventricle. A cortical sample was used as a control, to assure Dcx antibody specificity. C, Dcx immunostaining in hippocampal coronal sections of NaCl- and AraC-treated animals. Note that AraC infusion into the lateral ventricle affects neurogenesis in the dentate gyrus to a lesser degree compared with the OB. Scale bars, 200 μm.
Figure 2.
Figure 2.
The pre-existing population of interneurons is unaffected by the AraC treatment. A, Immunostaining for the neuronal marker NeuN in the different regions of the OB derived from control (NaCl) and AraC-treated animals. Scale bar, 50 μm. B, NeuN+ cell density quantification in the dorsal, lateral, medial, and ventral OB regions. Data are presented as mean ± SEM (n = 4 animals per group). C, Top, Confocal images of GFP+ granule cells revealing their complete morphology. These cells were labeled with an injection of GFP-encoding lentivirus in the rostral migratory stream 28 d before the NaCl or AraC treatment. Bottom, Higher magnification of boxed regions showing the spine density of the adult-generated granule cells. Scale bars, 20 μm. D, No changes in the primary dendrite length (calculated as the length of the dendrite from the soma to the first point of ramification) or the total dendritic length (excluding the primary dendrite) were observed in GFP+ cells between the control and neurogenesis-ablated OBs. Data are presented as mean ± SEM (n = 31 and 27 cells for control and AraC-treated groups, respectively). E, Spine density quantification of GFP+ cells generated in adulthood. Each point represents the spine density of individual cell, whereas horizontal bars represent the mean values for NaCl and AraC treatments.
Figure 3.
Figure 3.
Suppression of OB neurogenesis reduces inhibition on mitral cells. A, Individual experiments illustrating sPSCs, sIPSCs, and mIPSCs recorded from OB mitral cells of control (NaCl) and AraC-treated animals. Calibration: 100 ms, 500 pA. B, C, Quantification of the mean frequencies (B) and amplitudes (C) of sPSCs, sIPSCs, and mIPSCs. Data are presented as mean ± SEM (n = 9 and 8 cells for NaCl- and AraC-treated animals, respectively). *p < 0.05, **p < 0.01; Student's t test. D, Average mIPSCs from two single cells. The amplitudes of traces taken from control (black trace) and AraC-treated (gray trace) recordings were scaled to highlight unaltered kinetics of mIPSCs. Calibration: 10 ms. E, Quantification of mIPSCs decay and rise times. Data are presented as mean ± SEM (n = 9 and 8 cells for NaCl- and AraC-treated animals, respectively). F, Traces illustrating the dendrodendritic inhibition (DDI) following a 50 ms depolarizing step in mitral cells recorded from NaCl (black trace) and AraC-treated (gray trace) mice. Calibration: 500 ms, 1 nA. G, Quantification of the DDI amplitude (left) and charge (right) recorded from mitral cells in NaCl and AraC bulbs. The amplitude and charge of DDI were normalized (Norm. charge) to the capacitance for each recorded cell. Data are presented as mean ± SEM (n = 5 and 6 cells for control and AraC-infused animals, respectively). *p < 0.05; Student's t test.
Figure 4.
Figure 4.
Reduced number of GABAergic postsynaptic sites on the mitral cells lateral dendrite after the suppression of neurogenesis. A, Reconstitution of confocal images of the mitral cells filled with biocytin. MCL, Mitral cell layer; GCL, granule cell layer. The boxed regions show an example of sampling used for the quantification shown in H. B, Morphological analysis of the mitral cells demonstrating no significant difference in the primary and lateral dendrite lengths when neurogenesis is stopped. Data are presented as mean ± SEM (n = 10 and 9 cells for control and AraC-treated animals, respectively). CE, Membrane properties of mitral cells in control (NaCl) and AraC-treated animals. Top, Individual experiments illustrating TTX-sensitive Na+ currents and TEA- and 4AP-sensitive K+ currents recorded in mitral cells. Calibration: C, 2 nA, 50 ms; D, E, 500 pA, 50 ms. Bottom, Plot of the membrane potential as a function of the normalized conductance for the different currents recorded from the mitral cells in the saline- and AraC-treated animals. Note that there were no significant differences between different voltage-dependent currents. Data are presented as mean ± SEM (n = 10 cells in NaCl and 11 cells in AraC treatment for Na+ currents; n = 7 in both treatments for K+ currents). F, Confocal images of biocytin-labeled dendrite in NaCl- and AraC-treated OB stained for the postsynaptic GABAergic marker gephyrin. Scale bar, 5 μm. G, Enlarged orthogonal view of the gephyrin puncta indicated by an arrow in F. Scale bar, 2 μm. H, Gephyrin+ punctum density quantification on the mitral cell lateral dendrites for the NaCl- and AraC-treated mice (n = 9 cells for control and AraC-treated animals). Each dot represents the value for one single cell. Horizontal bars represent the mean value for all mitral cells for each condition. *p < 0.05; Student's t test.
Figure 5.
Figure 5.
Mice with ablated neurogenesis show reduced network oscillations. A, Top, LFP recordings in slices prepared from NaCl- or AraC-treated animals. Bottom, Autocorrelation graphs computed from traces recorded in the control and AraC-treated OBs. Note the reduced oscillation frequency in AraC-treated mice. Calibration: 50 ms, 20 μV. B, C, Peak frequencies (B) and oscillation indexes (C) of LFP oscillations in slices derived from control and AraC-treated mice. Data are presented as mean ± SEM (n = 13 and 8 slices for control and AraC-treated animals, respectively). *p < 0.05; Student's t test.
Figure 6.
Figure 6.
AraC treatment does not affect general locomotor and exploratory activities, anxiety, and motivation of the mouse. A, Left, Experimental design used for the locomotion test. Note that the mice were kept in a reversed light/dark cycle and tested 28 d after pump installation. Right, Results at different time points of the 60 min spontaneous locomotion test. Mice infused with NaCl or with AraC travel the same distance in the locomotion test. Data are presented as mean ± SEM (n = 9 and 8 animals for control and AraC-treated group). B, Left, Experimental design used for the object recognition test. The animals were tested 29 d after osmotic minipump installation. Right, Object exploration time in seconds for animals presented with two identical (habituation phase) or two different (test phase) objects. Mice with ablated neurogenesis are able to recognize the object in the same manner as control animals. Data are presented as mean ± SEM (n = 9 animals per group). *p < 0.05, **p < 0.01; Student's t test. C, Experimental design used for the tail suspension test (D) and novelty-suppressed feeding behavior test (E). Mice used in these test were food deprived. D, Immobility times of NaCl- and AraC-treated mice during a 6 min tail suspension test. Each dot represents the immobility time (in seconds) for one animal. Horizontal bars represent the mean values for all the animals for control and AraC-treated conditions (n = 8 and 7 animals, respectively). E, Feeding latencies of mice (in seconds) submitted to a novelty-suppressed feeding behavior test. Each dot represents the feeding latency for one animal, whereas horizontal bars represent the mean value for all the animals from control and AraC-treated conditions (n = 8 and 7 animals, respectively).
Figure 7.
Figure 7.
Reduced odor memory in mice with ablated neurogenesis. A, Experimental design (left) and odor detection threshold test in control and AraC-treated mice for three different odors (right). Normalized values are expressed as the mean ratio between the time spent investigating the odor and the total sniffing time (i.e., odor plus mineral oil). Data are presented as mean ± SEM (n = 8–9 animals per group). *p < 0.05; Student's t test. B, Experimental design (left) and odor discrimination test (right) in control (NaCl) and AraC-treated mice. Mice were habituated to an odor with four consecutive presentations. On the fifth presentation a different odor was presented. Both saline-treated and neurogenesis-ablated mice similarly increased the investigation time in response to the new odor. Data are presented as mean ± SEM (n = 9 and 8 animals for control and AraC-treated groups). **p < 0.01, ***p < 0.001 with paired Student's t test. C, Left, Experimental design for long-term odor-associative memory tasks. Right, The two groups of animals were trained for 4 d to associate a reward to a carvone-(+) odor. One day and 1 week later, the reward was removed and the digging time was measured when the mouse was exposed to carvone-(+) and carvone-(−). The two graphs represent the digging time 24 h and 1 week after training. Note that in both conditions, mice were able to recognize the reward-associated odor 24 h and 1 week after training. Data are presented as mean ± SEM (n = 8 animals per group). **p < 0.05, ***p < 0.01; Student's t test. D, Experimental design (left) and short-term olfactory memory test (right) in control (NaCl) and AraC-treated mice. Each bar represents the mean time spent investigating a given odor on the first (gray columns) and second (white columns) odor exposures. Note that control animals remember the first exposure of the odor 30, 60, 90, and 120 min later, whereas AraC-treated mice remember only 30 min later. Data are presented as mean ± SEM (n = 8 animals for NaCl- and n = 9 for AraC-treated mice). *p < 0.05, **p < 0.01 with paired Student's t test.

Comment in

Similar articles

Cited by

References

    1. Alonso M, Viollet C, Gabellec MM, Meas-Yedid V, Olivo-Marin JC, Lledo PM. Olfactory discrimination learning increases the survival of adult-born neurons in the olfactory bulb. J Neurosci. 2006;26:10508–10513. - PMC - PubMed
    1. Barkai E, Saar D. Cellular correlates of olfactory learning in the rat piriform cortex. Rev Neurosci. 2001;12:111–120. - PubMed
    1. Belluzzi O, Benedusi M, Ackman J, LoTurco JJ. Electrophysiological differentiation of new neurons in the olfactory bulb. J Neurosci. 2003;23:10411–10418. - PMC - PubMed
    1. Benson TE, Ryugo DK, Hinds JW. Effects of sensory deprivation on the developing mouse olfactory system: a light and electron microscopic, morphometric analysis. J Neurosci. 1984;4:638–653. - PMC - PubMed
    1. Bevins RA, Besheer J. Object recognition in rats and mice: a one-trial non-matching-to-sample learning task to study ‘recognition memory’. Nat Protoc. 2006;1:1306–1311. - PubMed

Publication types

MeSH terms