

ApoE4 decreases spine density and dendritic complexity in cortical neurons in vivo
- PMID: 19955384
- PMCID: PMC2846754
- DOI: 10.1523/JNEUROSCI.4026-09.2009
ApoE4 decreases spine density and dendritic complexity in cortical neurons in vivo
Abstract
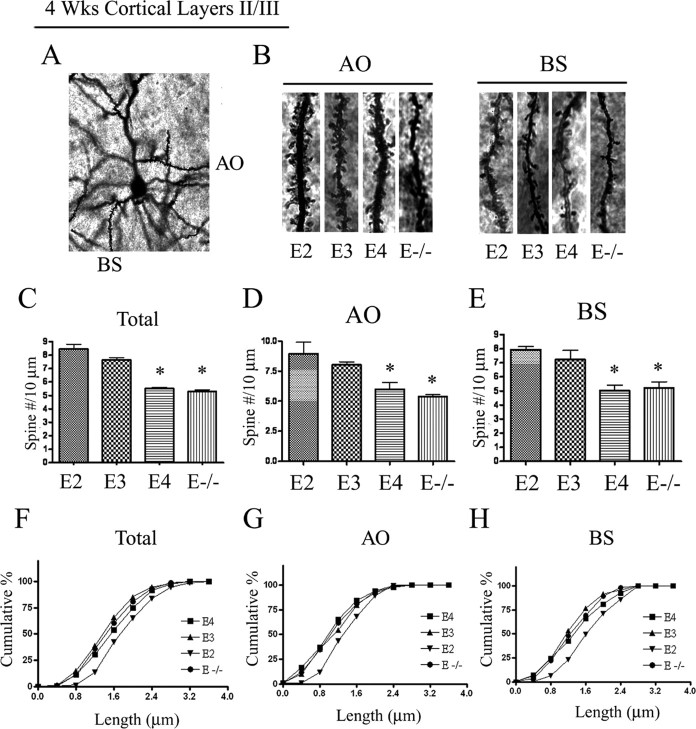
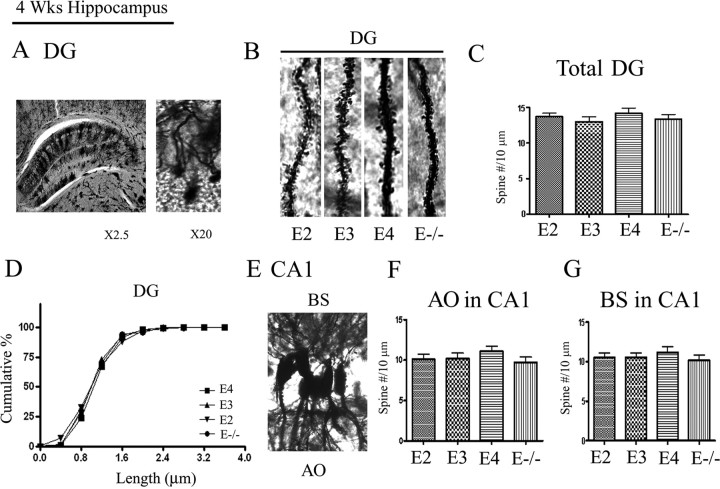
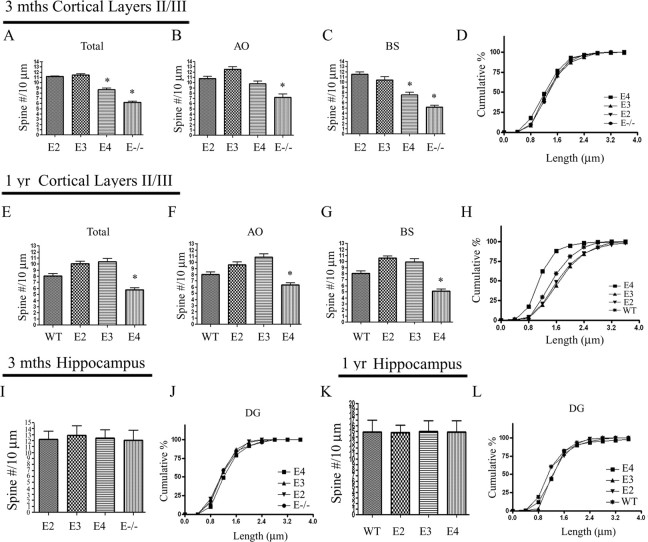
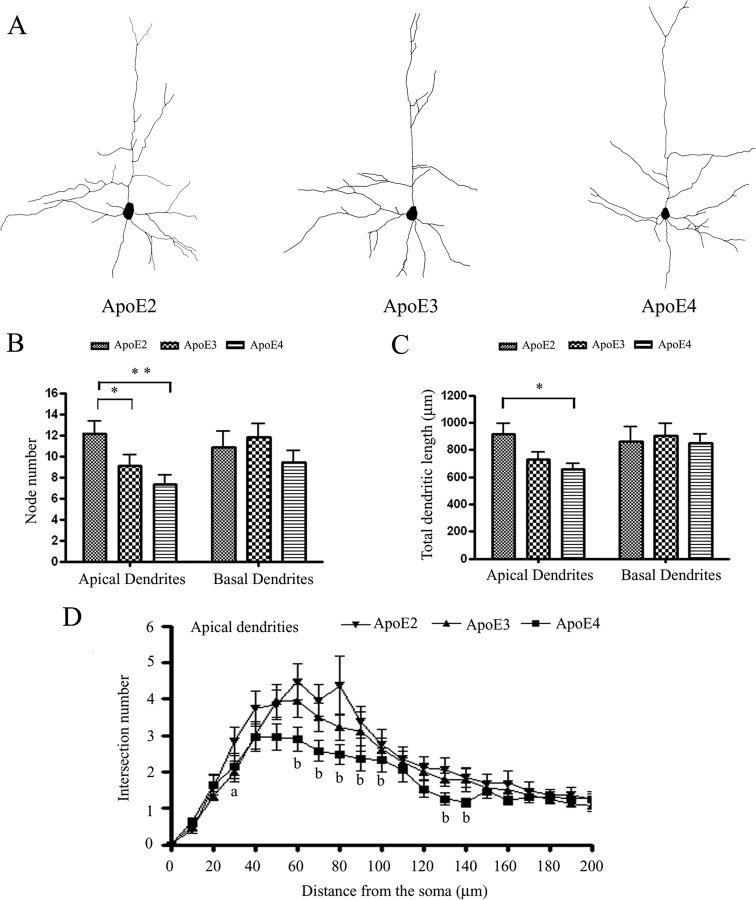
The three human alleles of apolipoprotein E (APOE) differentially influence outcome after CNS injury and affect one's risk of developing Alzheimer's disease (AD). It remains unclear how ApoE isoforms contribute to various AD-related pathological changes (e.g., amyloid plaques and synaptic and neuron loss). Here, we systematically examined whether apoE isoforms (E2, E3, E4) exhibit differential effects on dendritic spine density and morphology in APOE targeted replacement (TR) mice, which lack AD pathological changes. Using Golgi staining, we found age-dependent effects of APOE4 on spine density in the cortex. The APOE4 TR mice had significantly reduced spine density at three independent time points (4 weeks, 3 months, and 1 year, 27.7% +/- 7.4%, 24.4% +/- 8.6%, and 55.6% +/- 10.5%, respectively) compared with APOE3 TR mice and APOE2 TR mice. Additionally, in APOE4 TR mice, shorter spines were evident compared with other APOE TR mice at 1 year. APOE2 TR mice exhibited longer spines as well as significantly increased apical dendritic arborization in the cortex compared with APOE4 and APOE3 TR mice at 4 weeks. However, there were no differences in spine density across APOE genotypes in hippocampus. These findings demonstrate that apoE isoforms differentially affect dendritic complexity and spine formation, suggesting a role for APOE genotypes not only in acute and chronic brain injuries including AD, but also in normal brain functions.
Figures
Comment in
-
Differential effects of ApoE isoforms on dendritic spines in vivo: linking an Alzheimer's disease risk factor with synaptic alterations.J Neurosci. 2010 Mar 31;30(13):4526-7. doi: 10.1523/JNEUROSCI.0505-10.2010. J Neurosci. 2010. PMID: 20357102 Free PMC article. No abstract available.
Similar articles
-
ApoE4 delays dendritic spine formation during neuron development and accelerates loss of mature spines in vitro.ASN Neuro. 2014 Jan 13;6(1):e00134. doi: 10.1042/AN20130043. ASN Neuro. 2014. PMID: 24328732 Free PMC article.
-
Apolipoprotein E isoform-specific regulation of dendritic spine morphology in apolipoprotein E transgenic mice and Alzheimer's disease patients.Neuroscience. 2003;122(2):305-15. doi: 10.1016/j.neuroscience.2003.08.007. Neuroscience. 2003. PMID: 14614898
-
Differential Signaling Mediated by ApoE2, ApoE3, and ApoE4 in Human Neurons Parallels Alzheimer's Disease Risk.J Neurosci. 2019 Sep 11;39(37):7408-7427. doi: 10.1523/JNEUROSCI.2994-18.2019. Epub 2019 Jul 22. J Neurosci. 2019. PMID: 31331998 Free PMC article.
-
Apolipoprotein E and oxidative stress in brain with relevance to Alzheimer's disease.Neurobiol Dis. 2020 May;138:104795. doi: 10.1016/j.nbd.2020.104795. Epub 2020 Feb 6. Neurobiol Dis. 2020. PMID: 32036033 Free PMC article. Review.
-
Apolipoprotein E isoforms in Alzheimer's disease pathology and etiology.Microsc Res Tech. 2000 Aug 15;50(4):278-81. doi: 10.1002/1097-0029(20000815)50:4<278::AID-JEMT5>3.0.CO;2-T. Microsc Res Tech. 2000. PMID: 10936880 Review.
Cited by
-
Rapid estradiol modulation of neuronal connectivity and its implications for disease.Front Endocrinol (Lausanne). 2011 Nov 22;2:77. doi: 10.3389/fendo.2011.00077. eCollection 2011. Front Endocrinol (Lausanne). 2011. PMID: 22654827 Free PMC article.
-
ApoE4 induces Aβ42, tau, and neuronal pathology in the hippocampus of young targeted replacement apoE4 mice.Mol Neurodegener. 2013 May 17;8:16. doi: 10.1186/1750-1326-8-16. Mol Neurodegener. 2013. PMID: 23684315 Free PMC article.
-
Pathologies Underlying Longitudinal Cognitive Decline in the Oldest Old.Alzheimer Dis Assoc Disord. 2018 Oct-Dec;32(4):265-269. doi: 10.1097/WAD.0000000000000265. Alzheimer Dis Assoc Disord. 2018. PMID: 30052535 Free PMC article.
-
Apolipoprotein E4, inhibitory network dysfunction, and Alzheimer's disease.Mol Neurodegener. 2019 Jun 11;14(1):24. doi: 10.1186/s13024-019-0324-6. Mol Neurodegener. 2019. PMID: 31186040 Free PMC article. Review.
-
Structure-dependent impairment of intracellular apolipoprotein E4 trafficking and its detrimental effects are rescued by small-molecule structure correctors.J Biol Chem. 2011 May 13;286(19):17217-26. doi: 10.1074/jbc.M110.217380. Epub 2011 Mar 18. J Biol Chem. 2011. PMID: 21454574 Free PMC article.
References
-
- Alpár A, Ueberham U, Brückner MK, Seeger G, Arendt T, Gärtner U. Different dendrite and dendritic spine alterations in basal and apical arbors in mutant human amyloid precursor protein transgenic mice. Brain Res. 2006;1099:189–198. - PubMed
-
- Bellosta S, Nathan BP, Orth M, Dong LM, Mahley RW, Pitas RE. Stable expression and secretion of apolipoproteins E3 and E4 in mouse neuroblastoma cells produces differential effects on neurite outgrowth. J Biol Chem. 1995;270:27063–27071. - PubMed
-
- Daniele A, Matera MG, Seripa D, Acciarri A, Bizzarro A, Pilotto A, Masullo C. APOE ε2/ε4 genotype a risk factor for primary progressive aphasia in women. Arch Neurol. 2009;66:910–912. - PubMed
Publication types
MeSH terms
Substances
Grants and funding
LinkOut - more resources
Full Text Sources
Other Literature Sources
Molecular Biology Databases
Miscellaneous