

Impact of spatial clustering on disease transmission and optimal control
- PMID: 19955428
- PMCID: PMC2824282
- DOI: 10.1073/pnas.0909047107
Impact of spatial clustering on disease transmission and optimal control
Abstract
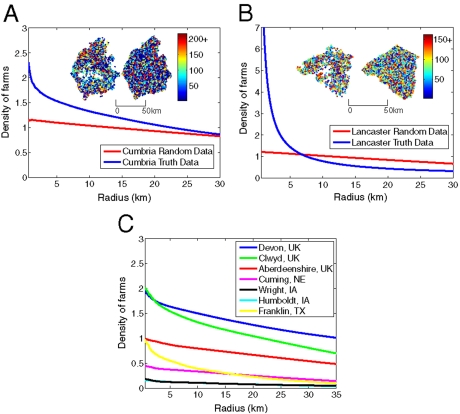
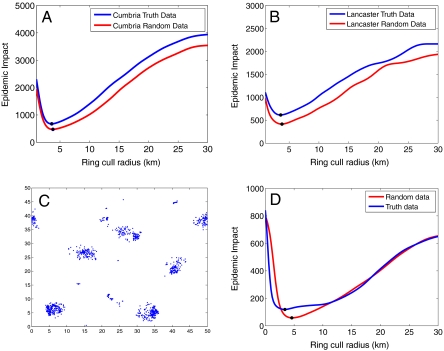
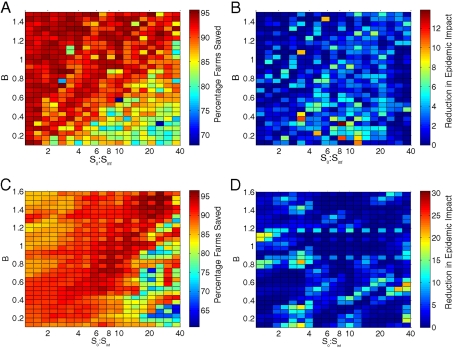
Spatial heterogeneities and spatial separation of hosts are often seen as key factors when developing accurate predictive models of the spread of pathogens. The question we address in this paper is how coarse the resolution of the spatial data can be for a model to be a useful tool for informing control policies. We examine this problem using the specific case of foot-and-mouth disease spreading between farms using the formulation developed during the 2001 epidemic in the United Kingdom. We show that, if our model is carefully parameterized to match epidemic behavior, then using aggregate county-scale data from the United States is sufficient to closely determine optimal control measures (specifically ring culling). This result also holds when the approach is extended to theoretical distributions of farms where the spatial clustering can be manipulated to extremes. We have therefore shown that, although spatial structure can be critically important in allowing us to predict the emergent population-scale behavior from a knowledge of the individual-level dynamics, for this specific applied question, such structure is mostly subsumed in the parameterization allowing us to make policy predictions in the absence of high-quality spatial information. We believe that this approach will be of considerable benefit across a range of disciplines where data are only available at intermediate spatial scales.
Conflict of interest statement
The authors declare no conflict of interest.
Figures
Comment in
-
Coping without farm location data during a foot-and-mouth outbreak.Proc Natl Acad Sci U S A. 2010 Jan 19;107(3):957-8. doi: 10.1073/pnas.0913286107. Epub 2010 Jan 8. Proc Natl Acad Sci U S A. 2010. PMID: 20080603 Free PMC article. No abstract available.
References
-
- Hassell MP, May RM. Aggregation of predators and insect parasites and its effect on stability. J Anim Ecol. 1974;43:567–594.
-
- Pacala SW, Hassell MP, May RM. Host parasitoid associations in patchy environments. Nature. 1990;344:150–153. - PubMed
-
- Kareiva P. Population-dynamics in spatially complex environments. Phil Trans Roy Soc Lond B. 1990;330:175–190.
-
- Tilman D. Competition and biodiversity in spatially structured habitats. Ecology. 1994;75:2–16.
-
- Ferguson NM, Cummings DAT, Cauchemez S, et al. Strategies for containing an emerging influenza pandemic in Southeast Asia. Nature. 2005;437:209–214. - PubMed
Publication types
MeSH terms
Grants and funding
LinkOut - more resources
Full Text Sources
