

The divergence of chimpanzee species and subspecies as revealed in multipopulation isolation-with-migration analyses
- PMID: 19955478
- PMCID: PMC2877540
- DOI: 10.1093/molbev/msp298
The divergence of chimpanzee species and subspecies as revealed in multipopulation isolation-with-migration analyses
Abstract
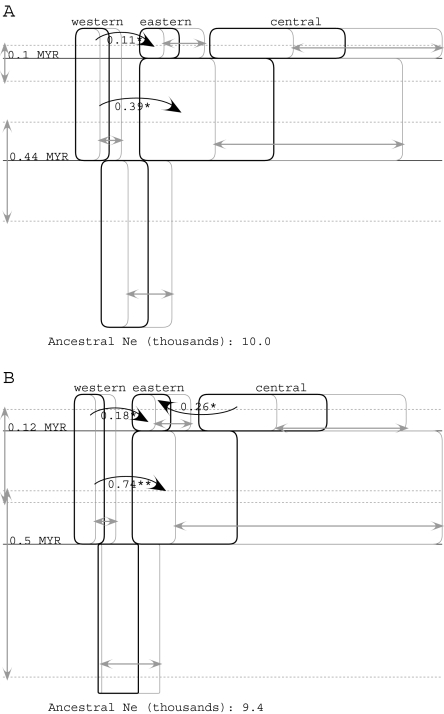
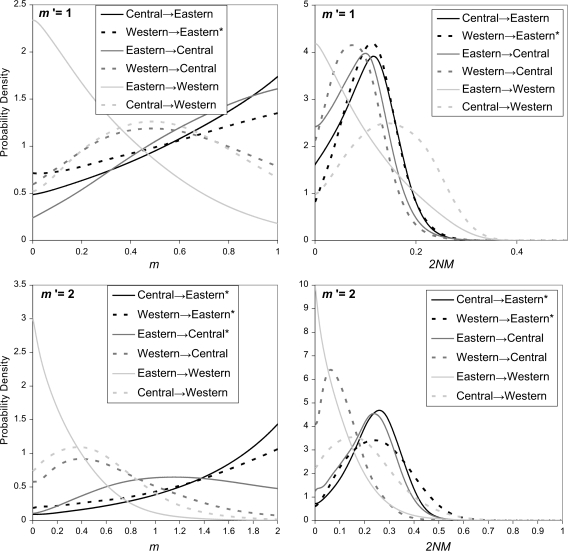
The divergence of bonobos and three subspecies of the common chimpanzee was examined under a multipopulation isolation-with-migration (IM) model with data from 73 loci drawn from the literature. A benefit of having a full multipopulation model, relative to conducting multiple pairwise analyses between sampled populations, is that a full model can reveal historical gene flow involving ancestral populations. An example of this was found in which gene flow is indicated between the western common chimpanzee subspecies and the ancestor of the central and the eastern common chimpanzee subspecies. The results of a full analysis on all four populations are strongly consistent with analyses on pairs of populations and generally similar to results from previous studies. The basal split between bonobos and common chimpanzees was estimated at 0.93 Ma (0.68-1.54 Ma, 95% highest posterior density interval), with the split among the ancestor of three common chimpanzee populations at 0.46 Ma (0.35-0.65), and the most recent split between central and eastern common chimpanzee populations at 0.093 Ma (0.041-0.157). Population size estimates mostly fell in the range from 5,000 to 10,000 individuals. The exceptions are the size of the ancestor of the common chimpanzee and the bonobo, at 17,000 (8,000-28,000) individuals, and the central common chimpanzee and its immediate ancestor with the eastern common chimpanzee, which have effective size estimates at 27,000 (16,000-44,000) and 32,000 (19,000-54,000) individuals, respectively.
Figures
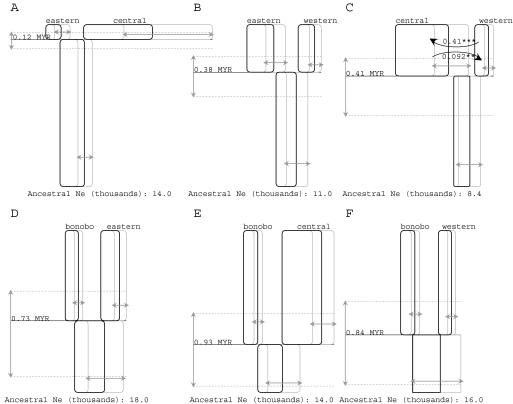
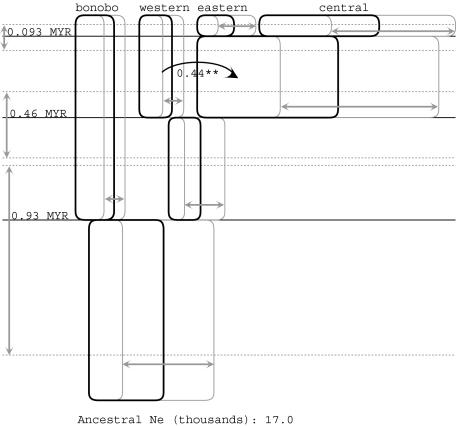
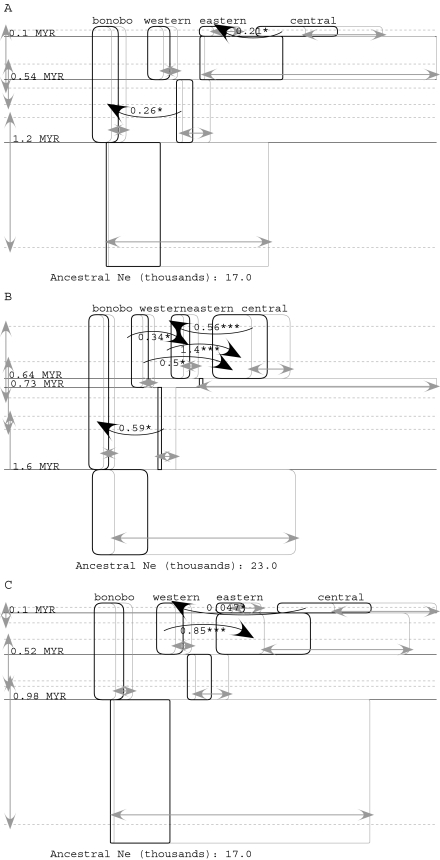
 . See figure 2 for further explanation of the meaning of symbols.
References
-
- Angus S. Water-contact behavior of chimpanzees. Folia Primatol. 1971;14:51–58. - PubMed
-
- Barton NH. The role of hybridization in evolution. Mol Ecol. 2001;10:551–568. - PubMed
-
- Beaumont M. Joint determination of topology, divergence time, and immigration in population trees. In: Matsumura S, Forster P, Renfrew C, editors. Simulation, genetics, and human prehistory. Cambridge, United Kingdom: McDonald Institute for Archaeological Research; 2008. pp. 135–154.
Publication types
MeSH terms
Grants and funding
LinkOut - more resources
Full Text Sources
