

Carbohydrates and activity of natural and recombinant tissue factor
- PMID: 19955571
- PMCID: PMC2823427
- DOI: 10.1074/jbc.M109.055178
Carbohydrates and activity of natural and recombinant tissue factor
Abstract
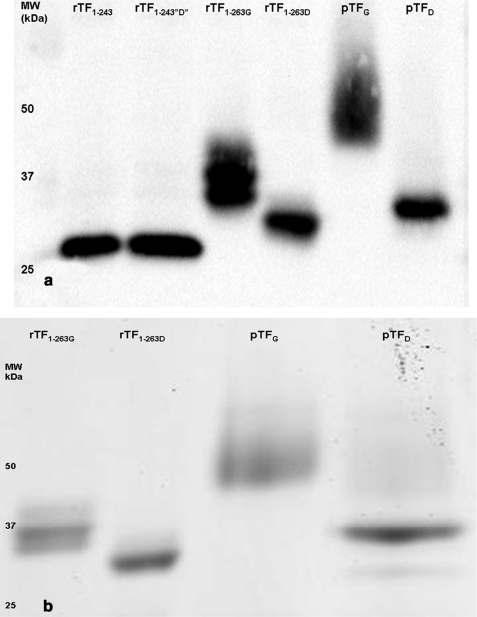
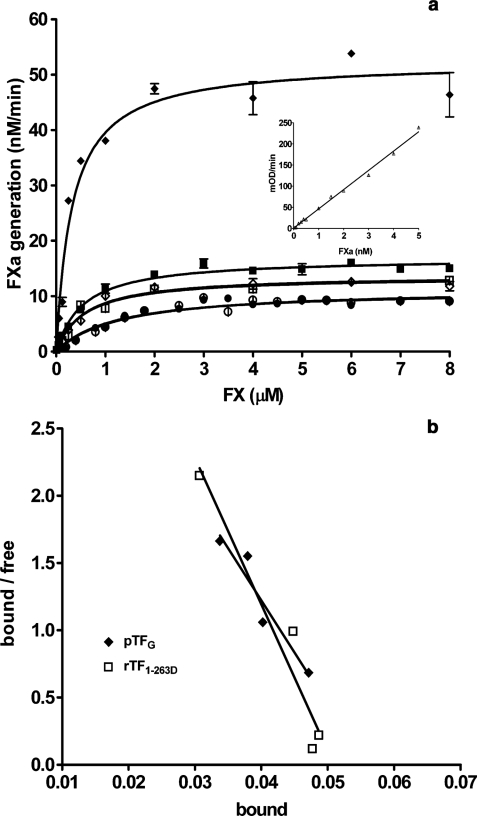
The effect of glycosylation on tissue factor (TF) activity was evaluated, and site-specific glycosylation of full-length recombinant TF (rTF) and that of natural TF from human placenta (pTF) were studied by liquid chromatography-tandem mass spectrometry. The amidolytic activity of the TF.factor VIIa (FVIIa) complex toward a fluorogenic substrate showed that the catalytic efficiency (V(max)) of the complex increased in the order rTF(1-243) (Escherichia coli) < rTF(1-263) (Sf9 insect cells) < pTF for the glycosylated and deglycosylated forms. Substrate hydrolysis was unaltered by deglycosylation. In FXase, the K(m) of FX for rTF(1-263)-FVIIa remained unchanged after deglycosylation, whereas the k(cat) decreased slightly. A pronounced decrease, 4-fold, in k(cat) was observed for pTF.FVIIa upon deglycosylation, whereas the K(m) was minimally altered. The parameters of FX activation by both rTF(1-263D)-FVIIa and pTF(D)-FVIIa were identical and similar to those for rTF(1-243)-FVIIa. In conclusion, carbohydrates significantly influence the activity of TF proteins. Carbohydrate analysis revealed glycosylation on asparagines 11, 124, and 137 in both rTF(1-263) and pTF. The carbohydrates of rTF(1-263) contain high mannose, hybrid, and fucosylated glycans. Natural pTF contains no high mannose glycans but is modified with hybrid, highly fucosylated, and sialylated sugars.
Figures
Similar articles
-
Posttranslational modifications and activity of natural and recombinant tissue factor.Thromb Res. 2010 Apr;125 Suppl 1:S26-8. doi: 10.1016/j.thromres.2010.01.028. Epub 2010 Feb 6. Thromb Res. 2010. PMID: 20138335 Free PMC article. Review.
-
Differences in the fractional abundances of carbohydrates of natural and recombinant human tissue factor.Biochim Biophys Acta. 2011 Apr;1810(4):398-405. doi: 10.1016/j.bbagen.2010.12.003. Epub 2010 Dec 21. Biochim Biophys Acta. 2011. PMID: 21172408 Free PMC article.
-
Tissue factor alters the pK(a) values of catalytically important factor VIIa residues.Biochemistry. 2002 Mar 12;41(10):3364-71. doi: 10.1021/bi0110847. Biochemistry. 2002. PMID: 11876644
-
Role of zymogen and activated factor X as scaffolds for the inhibition of the blood coagulation factor VIIa-tissue factor complex by recombinant nematode anticoagulant protein c2.J Biol Chem. 2001 Mar 30;276(13):10063-71. doi: 10.1074/jbc.M009116200. Epub 2001 Jan 3. J Biol Chem. 2001. PMID: 11139576
-
Modulators of the coagulation cascade: focus and recent advances in inhibitors of tissue factor, factor VIIa and their complex.Curr Med Chem. 2005;12(4):397-417. doi: 10.2174/0929867053363108. Curr Med Chem. 2005. PMID: 15720249 Review.
Cited by
-
Syncytiotrophoblast microvesicles released from pre-eclampsia placentae exhibit increased tissue factor activity.PLoS One. 2011;6(10):e26313. doi: 10.1371/journal.pone.0026313. Epub 2011 Oct 14. PLoS One. 2011. PMID: 22022598 Free PMC article.
-
Interference of lupus anticoagulant causing antiprothrombin and anti-beta-2-glycoprotein I antibodies on international normalized ratio measurements: comparative analysis of international normalized ratio methods.Res Pract Thromb Haemost. 2024 Jun 8;8(5):102470. doi: 10.1016/j.rpth.2024.102470. eCollection 2024 Jul. Res Pract Thromb Haemost. 2024. PMID: 39109234 Free PMC article.
-
Posttranslational modifications and activity of natural and recombinant tissue factor.Thromb Res. 2010 Apr;125 Suppl 1:S26-8. doi: 10.1016/j.thromres.2010.01.028. Epub 2010 Feb 6. Thromb Res. 2010. PMID: 20138335 Free PMC article. Review.
-
Tissue factor controversies.Thromb Res. 2012 May;129 Suppl 2(Suppl 2):S5-7. doi: 10.1016/j.thromres.2012.02.018. Epub 2012 Mar 7. Thromb Res. 2012. PMID: 22401799 Free PMC article. Review.
-
Tissue factor in cancer-associated thromboembolism: possible mechanisms and clinical applications.Br J Cancer. 2022 Dec;127(12):2099-2107. doi: 10.1038/s41416-022-01968-3. Epub 2022 Sep 12. Br J Cancer. 2022. PMID: 36097177 Free PMC article. Review.
References
Publication types
MeSH terms
Substances
Grants and funding
LinkOut - more resources
Full Text Sources
Miscellaneous
