. 2010 Jan;120(1):191-202.
doi: 10.1172/JCI38388. Epub 2009 Dec 1.

Deletion of Fas in adipocytes relieves adipose tissue inflammation and hepatic manifestations of obesity in mice

Affiliations

Deletion of Fas in adipocytes relieves adipose tissue inflammation and hepatic manifestations of obesity in mice

Stephan Wueest et al. J Clin Invest. 2010 Jan.

Abstract

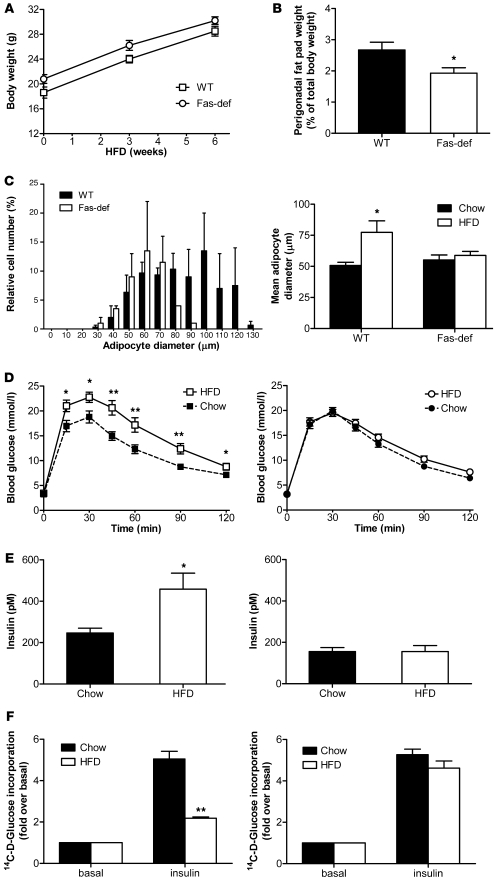
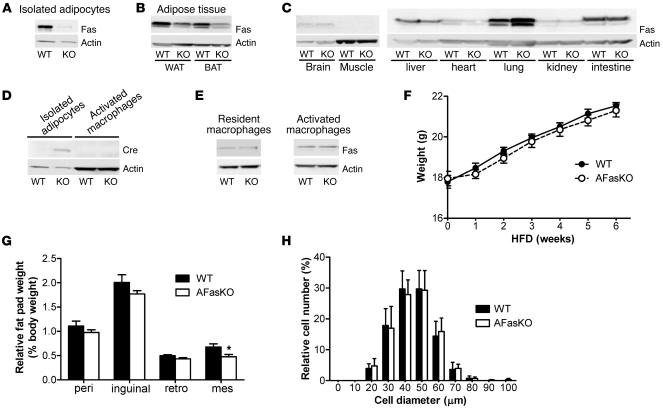
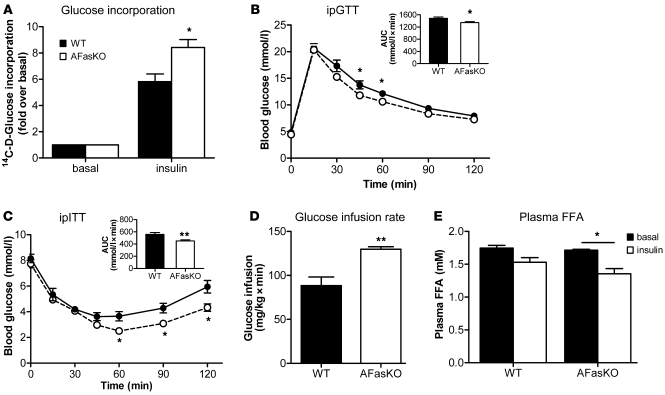
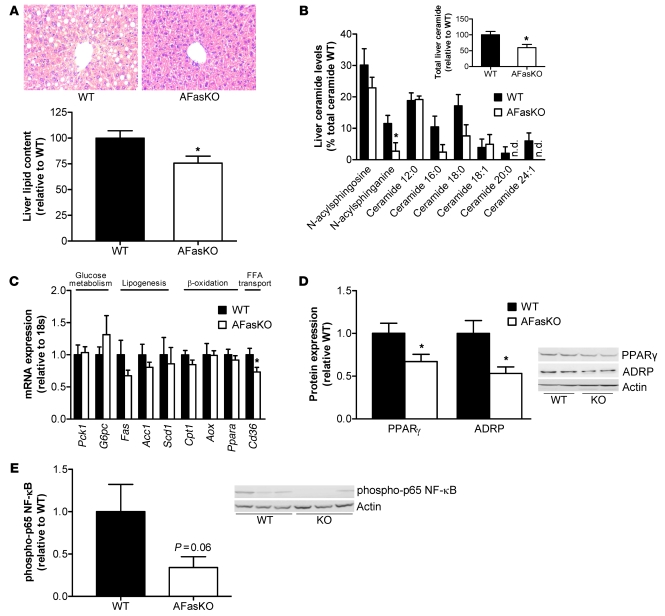
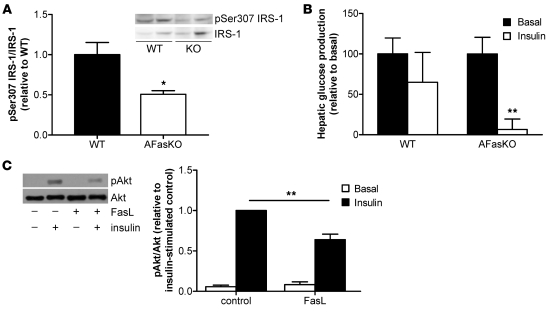
Adipose tissue inflammation is linked to the pathogenesis of insulin resistance. In addition to exerting death-promoting effects, the death receptor Fas (also known as CD95) can activate inflammatory pathways in several cell lines and tissues, although little is known about the metabolic consequence of Fas activation in adipose tissue. We therefore sought to investigate the contribution of Fas in adipocytes to obesity-associated metabolic dysregulation. Fas expression was markedly increased in the adipocytes of common genetic and diet-induced mouse models of obesity and insulin resistance, as well as in the adipose tissue of obese and type 2 diabetic patients. Mice with Fas deficiency either in all cells or specifically in adipocytes (the latter are referred to herein as AFasKO mice) were protected from deterioration of glucose homeostasis induced by high-fat diet (HFD). Adipocytes in AFasKO mice were more insulin sensitive than those in wild-type mice, and mRNA levels of proinflammatory factors were reduced in white adipose tissue. Moreover, AFasKO mice were protected against hepatic steatosis and were more insulin sensitive, both at the whole-body level and in the liver. Thus, Fas in adipocytes contributes to adipose tissue inflammation, hepatic steatosis, and insulin resistance induced by obesity and may constitute a potential therapeutic target for the treatment of insulin resistance and type 2 diabetes.


Figures

Figure 1
Figure 1. Fas expression is increased in adipocytes isolated from insulin-resistant mice and in adipose tissue of obese and diabetic patients.
(A) Total cell lysates were prepared from isolated perigonadal adipocytes harvested from db/db, ob/ob, and WT control mice. Lysates were resolved by LDS-PAGE and immunoblotted with anti-Fas or anti-actin antibody. Results are mean ± SEM of 3 mice per group and normalized to actin expression. *P < 0.05 (Student’s t test). (B) Total cell lysates were prepared from isolated adipocytes of perigonadal fat pads of chow-fed and HFD-fed (8 weeks of HFD) mice. Lysates were resolved by LDS-PAGE and immunoblotted with anti-Fas or anti-actin antibody. Results are mean ± SEM of 3 mice per group and normalized to actin expression. *P < 0.05 (1-sample t test). (C) Total RNA was extracted from perigonadal fat pads, and quantitative RT-PCR was performed. The level of mRNA expression was normalized to 18S RNA. Results represent mean ± SEM of 3 animals per group. *P < 0.05, **P < 0.01 (Student’s t test). (D) Tissue lysates from subcutaneous fat biopsies of lean, obese, and diabetic patients were prepared and immunoblotted with anti-Fas or anti-actin antibody. Results are mean ± SEM of 5–10 patients per group and normalized to actin expression. *P < 0.05 (ANOVA).
Figure 2
Figure 2. Fas-def mice are protected from HFD-induced changes in adipose tissue and glucose homeostasis.
(A) Weight gain was analyzed in HFD-fed WT and Fas-def mice. Results are mean ± SEM of 10 animals per group. (B) Perigonadal fat pads were harvested and weighed. Results are expressed relative to total body weight and represent mean ± SEM of 10–15 mice group. *P < 0.05 (Student’s t test). (C) Left: Relative size distribution of adipocyte diameter after 6 weeks of HFD. Results represent mean ± SEM of 6 mice per group. Right: Mean adipocyte diameter of chow- or HFD-fed Fas-def and WT mice. Results represent mean ± SEM of 6 mice per group. *P < 0.05 (Student’s t test). (D) Intraperitoneal glucose tolerance tests in WT (left) and Fas-def (right) mice. Results are mean ± SEM of 12–18 animals per group. *P < 0.05, **P < 0.01 (Student’s t test). (E) Fasting insulin levels were determined in WT (left) and Fas-def (right) mice after 8 hours of food withdrawal. Results are mean ± SEM of 4–5 animals per group. *P < 0.05 (Student’s t test). (F) 14C-d-glucose incorporation into isolated adipocytes from chow- and HFD-fed mice was determined in the absence or presence of insulin. Left: Fold glucose incorporation in WT mice. Right: Fold glucose incorporation in Fas-def mice. Results represent mean ± SEM of 6 experiments. **P < 0.01 (Student’s t test).
Figure 3
Figure 3. Fas activation in 3T3-L1 adipocytes decreases insulin sensitivity and stimulates lipolysis.
Mature 3T3-L1 adipocytes were incubated with 2 ng/ml FasL for 12 hours. (A) 3H-2dG glucose uptake was determined after treatment with or without insulin at different concentrations. Shown are absolute values of 3H-2dG uptake in untreated or FasL-treated 3T3-L1 adipocytes. Results are mean ± SEM of 5–9 independent experiments. *P < 0.05 (ANOVA). (B) Glycerol release was determined after medium was removed and cells were incubated with KREBS buffer for another hour. Results represent mean ± SEM of 4 independent experiments. **P < 0.01 (1-sample t test).
Figure 4
Figure 4. Characterization of AFasKO mice.
(A) Total cell lysates were prepared from isolated adipocytes of WT (Fasfl/fl;Fabp4-Cre–/–) and AFasKO (Fasfl/fl;Fabp4-Cre+/–) mice. Lysates were resolved by LDS-PAGE and immunoblotted with anti-Fas or anti-actin antibody. (B and C) Tissue lysates were prepared and resolved by LDS-PAGE and immunoblotted with anti-Fas or anti-actin antibody. (D) Total cell lysates (80 μg) from adipocytes and macrophages were prepared, resolved by LDS-PAGE, and immunoblotted with anti-Cre or anti-actin antibody. (E) Total cell lysates from resident and activated macrophages were prepared, resolved by LDS-PAGE, and immunoblotted with anti-Fas or anti-actin antibody. (F) Weight gain was analyzed in WT and AFasKO mice. Results are mean ± SEM of 14–15 animals per group. (G) Different fat pads were harvested and weighed. Results are expressed relative to total body weight and represent mean ± SEM of 14 mice per group. *P < 0.05. peri, perigonadal; retro, retroperitoneal; mes, mesenteric. (H) The size of isolated perigonadal adipocytes was analyzed. For each mouse, at least 100 adipocytes were analyzed. Images were analyzed using NIH ImageJ software for quantification. Results represent mean ± SEM of 4–5 mice per group.
Figure 5
Figure 5. AFasKO mice are protected from HFD-induced deteriorations in glucose metabolism.
(A) 14C-d-glucose incorporation into isolated perigonadal adipocytes from WT (Fasfl/fl;Fabp4-Cre–/–) and AFasKO (Fasfl/fl;Fabp4-Cre+/–) mice was determined in the absence or presence of insulin. Results are expressed relative to basal uptake and represent mean ± SEM of 5 independent experiments performed in triplicate. *P < 0.05 (Student’s t test). Intraperitoneal glucose (B) and insulin (C) tolerance tests (ipGTT and ipITT) were performed in WT (filled circles) and AFasKO (open circles) mice. Inset graphs in B and C depict the respective analysis of the area under the curve. Results are mean ± SEM of 8–10 animals per group. *P < 0.05, **P < 0.01 (Student’s t test). (D) Steady-state glucose infusion rates during hyperinsulinemic-euglycemic clamps. Results are mean ± SEM of 3–4 animals per group. **P < 0.01 (Student’s t test). (E) Plasma FFA levels in HFD-fed WT and AFasKO mice before and at the end of a euglycemic-hyperinsulinemic clamp are depicted. Results are mean ± SEM of 3 animals per group. *P < 0.05 (Student’s t test).
Figure 6
Figure 6. Reduced inflammatory profile in HFD-fed AFasKO mice.
(A) Quantitative RT-PCR detection of mRNA expression in WAT. The level of mRNA expression was normalized to 18S RNA. Results are mean ± SEM of 5–9 animals per group. *P < 0.05, **P < 0.01 (Student’s t test). (B) Plasma concentration of IL-6. Results represent mean ± SEM of 5 animals per group. *P < 0.05 (Student’s t test).
Figure 7
Figure 7. Increased secretion of immunoattractant cytokines and higher macrophage adherence in FasL-treated 3T3-L1 adipocytes.
(A) Fas ligation increases expression of proinflammatory cytokines in 3T3-L1 adipocytes. Mature 3T3-L1 adipocytes were incubated in the presence or absence of 2 ng/ml FasL for 12 hours. Medium was removed, and cells were incubated with KREBS buffer. Cytokine levels were then determined in the supernatant. Shown are results normalized to untreated cells. Results represent mean ± SEM of 4–5 independent experiments. *P < 0.05 (1-sample t test). (B) Mature 3T3-L1 adipocytes were incubated in the presence or absence (control [Co]) of 2 ng/ml FasL for 12 hours. Thereafter, adipocytes were incubated with 3H-labeled macrophages for 1 hour at 37°C. Cells were washed and lysed (0.05N NaOH). Finally, radioactivity of lysates was determined by a beta counter. Results represent mean ± SEM of 7 independent experiments. *P < 0.05 (1-sample t test).
Figure 8
Figure 8. Reduced hepatic steatosis in HFD-fed AFasKO mice.
(A) H&E-stained liver sections from WT (Fasfl/fl;Fabp4-Cre–/–) and AFasKO (Fasfl/fl;Fabp4-Cre+/–) mice (original magnification, ×40). Total liver lipids were determined and expressed relative to lipid content in WT mice. Results represent mean ± SEM of 8 mice of each group. *P < 0.05 (Student’s t test). (B) Levels of detected liver ceramide species are shown. Results are mean ± SEM of 6–8 animals per group and are expressed relative to total lipids in WT mice. *P < 0.05 (Student’s t test). n.d., not detected. (C) mRNA expression of indicated markers in liver tissue of WT and AFasKO mice was analyzed. Results are mean ± SEM of 5–9 mice per group, expressed relative to WT and normalized to expression of 18S. *P < 0.05 (Student’s t test). (D and E) Liver lysates were prepared from WT and AFasKO mice and resolved by LDS-PAGE. (D) Lysates were immunoblotted with ADRP, PPARγ, or actin antibodies. Results are mean ± SEM of 4–6 animals per group and expressed relative to protein expression in WT mice. *P < 0.05 (Student’s t test). (E) Lysates were immunoblotted with anti–phospho–p65 NF-κB or anti-actin antibody. Expression levels of phospho-p65 are normalized to expression of actin. Results are mean ± SEM of 5–6 mice and expressed relative to WT.
Figure 9
Figure 9. Improved hepatic insulin sensitivity in AFasKO mice.
(A) Lysates were immunoblotted with anti–phospho-IRS1 (Ser307) and total IRS1 antibody. Expression levels of pSer307 are normalized to expression of total IRS1. Results are mean ± SEM of 4 mice and expressed relative to WT. *P < 0.05 (Student’s t test). (B) Hepatic glucose production was calculated in the basal period and in response to insulin infusion during the hyperinsulinemic-euglycemic clamp study. Results are mean ± SEM of 3–4 animals per group and expressed relative to basal hepatic glucose production. **P < 0.01 (Student’s t test). (C) 3T3-L1 adipocytes were incubated with or without FasL for 12 hours, and subsequently, supernatant was collected for 24 hours. Hepatoma cells (Fao) were incubated with the conditioned medium for 24 hours. Total cell lysates were prepared and resolved by LDS-PAGE and immunoblotted with anti–phospho-Akt or Akt antibody. Results are mean ± SEM of 7–9 independent experiments. **P < 0.01 (ANOVA).

Comment in

References

    1. Scherer PE. Adipose tissue: from lipid storage compartment to endocrine organ. Diabetes. 2006;55(6):1537–1545. - PubMed
    1. Wellen KE, Hotamisligil GS. Inflammation, stress, and diabetes. J Clin Invest. 2005;115(5):1111–1119. - PMC - PubMed
    1. Park SY, et al. Unraveling the temporal pattern of diet-induced insulin resistance in individual organs and cardiac dysfunction in C57BL/6 mice. Diabetes. 2005;54(12):3530–3540. doi: 10.2337/diabetes.54.12.3530. - DOI - PubMed
    1. Poirier H, Shapiro JS, Kim RJ, Lazar MA. Nutritional supplementation with trans-10, cis-12-conjugated linoleic acid induces inflammation of white adipose tissue. Diabetes. 2006;55(6):1634–1641. doi: 10.2337/db06-0036. - DOI - PubMed
    1. Zick Y. Ser/Thr phosphorylation of IRS proteins: a molecular basis for insulin resistance. Sci STKE. 2005;(268):pe4. - PubMed

Publication types