

A Minimalist Approach to MALDI Imaging of Glycerophospholipids and Sphingolipids in Rat Brain Sections
- PMID: 19956342
- PMCID: PMC2614269
- DOI: 10.1016/j.ijms.2008.04.005
A Minimalist Approach to MALDI Imaging of Glycerophospholipids and Sphingolipids in Rat Brain Sections
Abstract
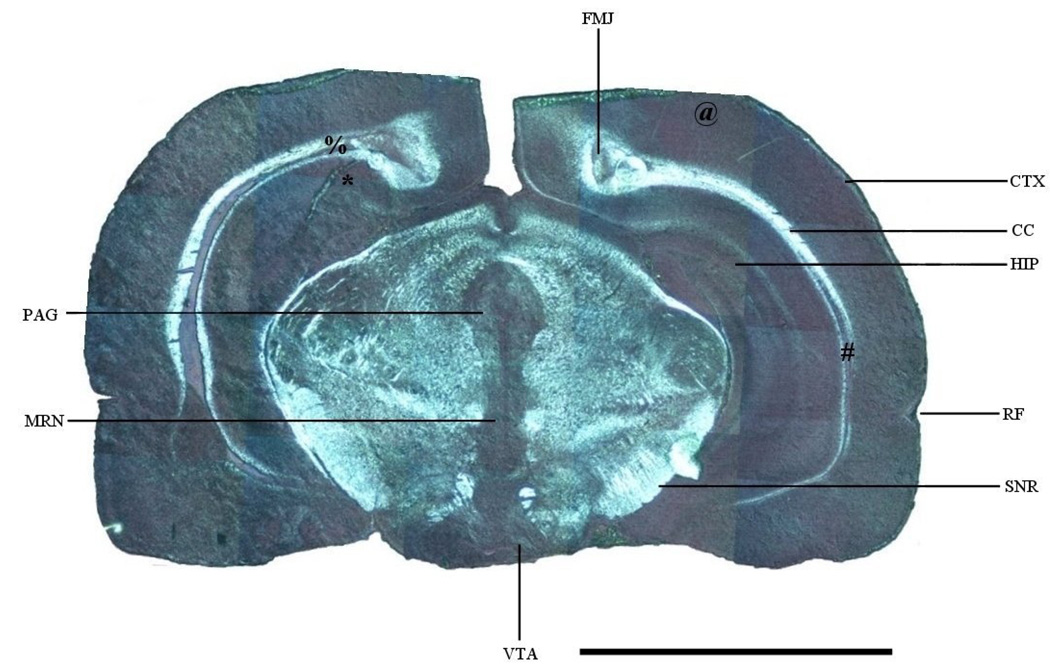
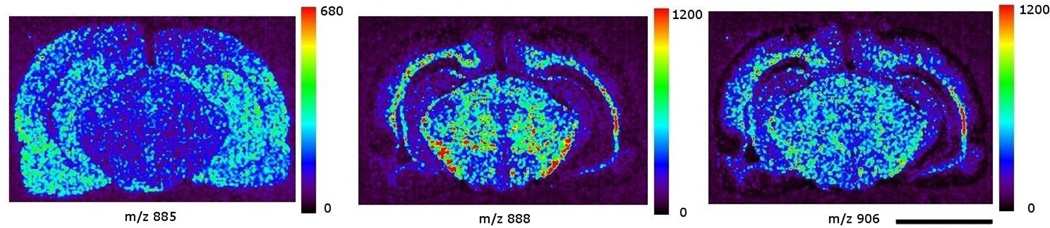
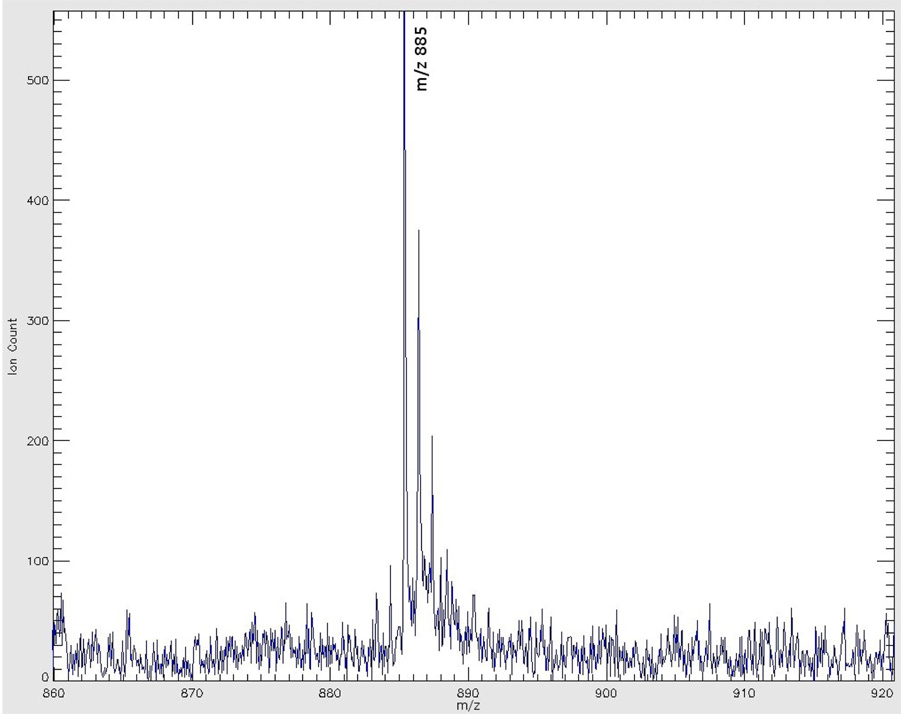
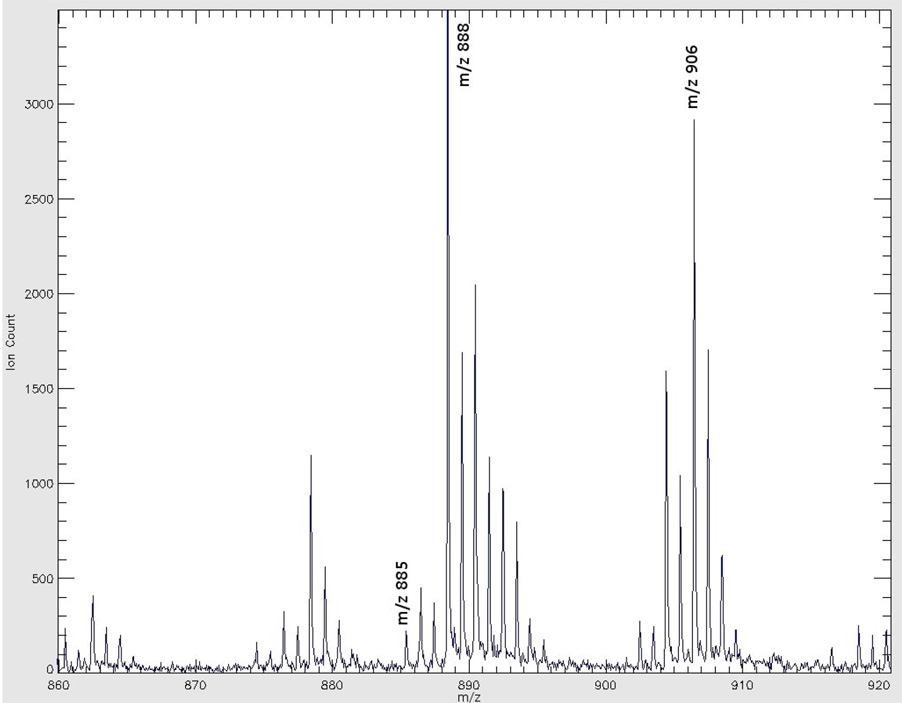
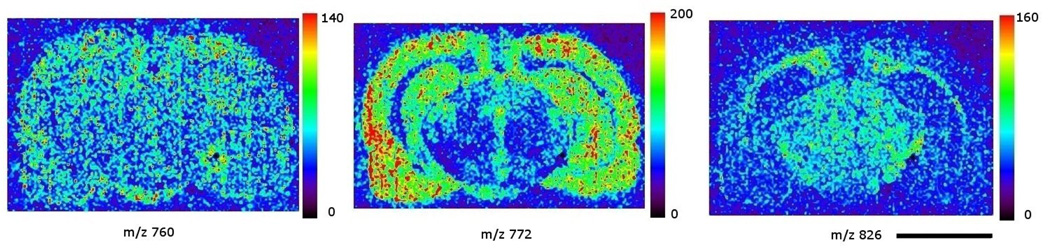
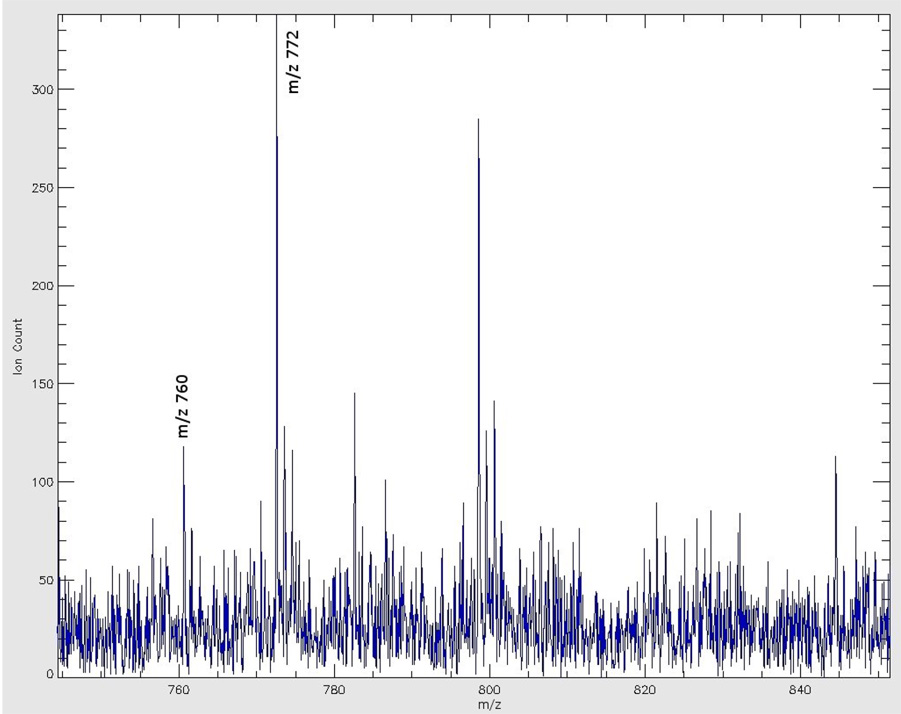
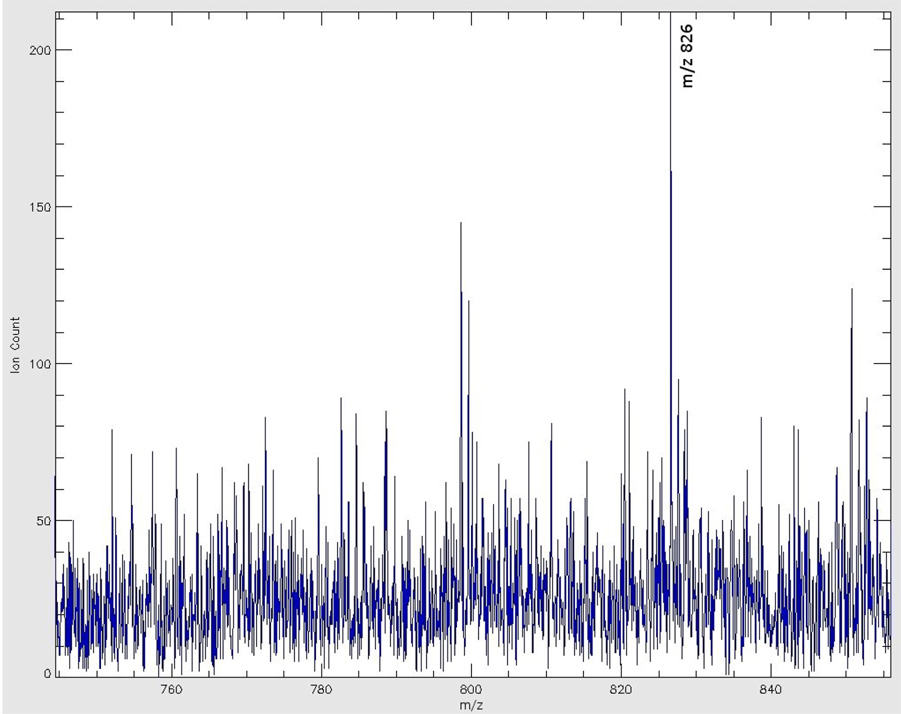
Matrix assisted laser desorption/ionization mass spectrometry (MALDI-MS) is a powerful tool that has allowed researchers to directly probe tissue molecular structure and drug content with minimal manipulations, while maintaining anatomical integrity. In the present work glycerophospholipids and sphingolipids images were acquired from 16 µm thick coronal rat brain sections using MALDI-MS. Images of phosphatidylinositol 38:4 (PI 38:4), suifatide 24:1 (ST 24:1), and hydroxyl sulfatide 24:1 (ST 24:1 (OH)) were acquired in negative ion mode, while the images of phosphatidylcholine 34:1 (PC 34:1), potassiated phosphatidylcholines 32:0 (PC32:0 + K(+)) and 36:1 (PC 36:1 +K(+)) were acquired in positive ion mode. The images of PI 38:4 and PC 36:1+K(+) show the preferential distribution of these two lipids in gray matter; and the images of two sulfatides and PC 32:0+K(+) show their preferential distribution in white matter. In addition, the gray cortical band and its adjacent anatomical structures were also identified by contrasting their lipid makeup. The resulting images were compared to lipid images acquired by secondary ion mass spectrometry (SIMS). The suitability of TLC sprayers, Collison Nebulizer, and artistic airbrush were also evaluated as means for matrix deposition.
Figures
References
-
- Edmonson RD, Russell DH. High-Resolution Mass Spectrometry and Accurate Mass Measurement of Biopolymers Using MALDI-TOF. In: Larsen BS, McEwen CN, editors. Mass Spectrometry of Biological Materials. 2nd ed. New York: Marcel Dekker; 1998. pp. 29–52.
-
- Chaurand P, Schwartz SA, Caprioli RM. Imaging mass spectrometry: a new tool to investigate the spatial organization of peptides and proteins in mammalian tissue sections. Curr. Opin. Chem. Biol. 2002;6(5):676–681. - PubMed
-
- Caldwell RL, Caprioloi RM. Tissue profiling by mass spectrometry: a review of methodology and applications. Mol. Cel. Proteomics. 2005;4(4):394–401. - PubMed
-
- Reyzer ML, Hsieh Y, Ng K, Korfmacher WA, Caprioloi RM. Direct analysis of drug candidates in tissue by matrix-assisted laser desorption/ionization mass spectrometry. J. Mass Spectrom. 2003;38(10):1081–1092. - PubMed
-
- Troendle FJ, Reddick CD, Yost RA. Detection of pharmaceutical compounds in tissue by matrix-assisted laser desorption/ionization and laser desorption/chemical ionization tandem mass spectrometry with a quadrupole ion trap. J. Am. Soc. Mass Spectrom. 1999;10(12):1315–1321.
Grants and funding
LinkOut - more resources
Full Text Sources
Research Materials
Miscellaneous