

Multiparametric characterization of grade 2 glioma subtypes using magnetic resonance spectroscopic, perfusion, and diffusion imaging
- PMID: 19956389
- PMCID: PMC2781083
- DOI: 10.1593/tlo.09178
Multiparametric characterization of grade 2 glioma subtypes using magnetic resonance spectroscopic, perfusion, and diffusion imaging
Abstract
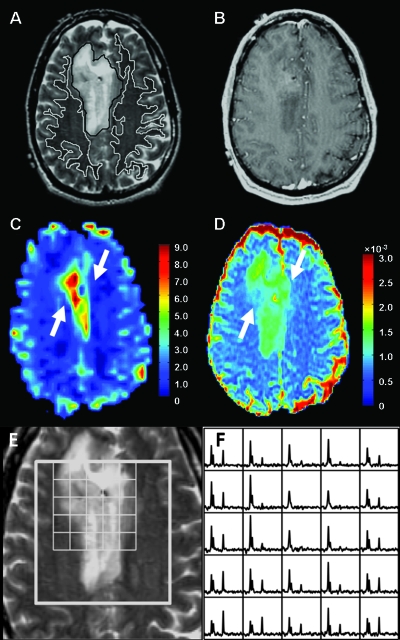
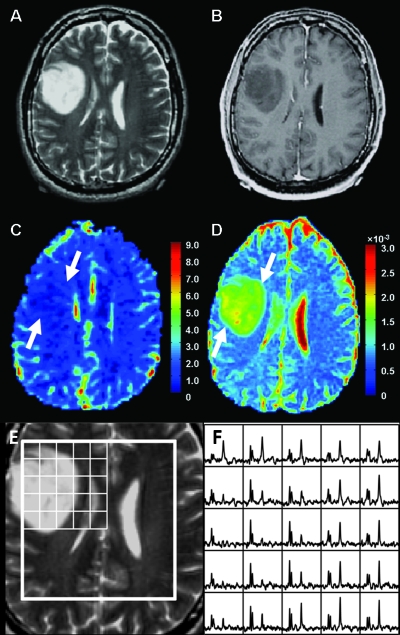
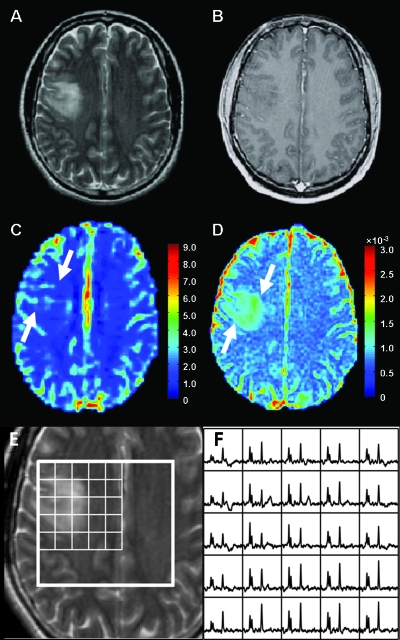
Background and purpose: The purpose of this study was to derive quantitative parameters from magnetic resonance (MR) spectroscopic, perfusion, and diffusion imaging of grade 2 gliomas according to the World Health Organization and to investigate how these multiple imaging modalities can contribute to evaluating their histologic subtypes and spatial characteristics.
Materials and methods: MR spectroscopic, perfusion, and diffusion images from 56 patients with newly diagnosed grade 2 glioma (24 oligodendrogliomas, 18 astrocytomas, and 14 oligoastrocytomas) were retrospectively studied. Metabolite intensities, relative cerebral blood volume (rCBV), and apparent diffusion coefficient (ADC) were statistically evaluated.
Results: The 75th percentile rCBV and median ADC were significantly different between oligodendrogliomas and astrocytomas (P < .0001) and between oligodendrogliomas and oligoastrocytomas (P < .001). Logistic regression analysis identified both 75th percentile rCBV and median ADC as significant variables in the differentiation of oligodendrogliomas from astrocytomas and oligoastrocytomas. Group differences in metabolite intensities were not significant, but there was a much larger variation in the volumes and maximum values of metabolic abnormalities for patients with oligodendroglioma compared with the other tumor subtypes.
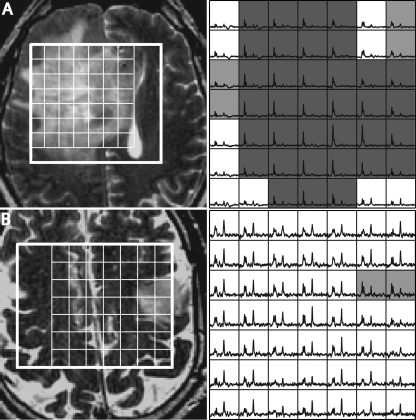
Conclusions: Perfusion and diffusion imaging provide quantitative MR parameters that can help to differentiate grade 2 oligodendrogliomas from grade 2 astrocytomas and oligoastrocytomas. The large variations in the magnitude and spatial extent of the metabolic lesions between patients and the fact that their values are not correlated with the other imaging parameters indicate that MR spectroscopic imaging may provide complementary information that is helpful in targeting therapy, evaluating residual disease, and assessing response to therapy.
Figures
References
-
- Mason WP, Krol GS, DeAngelis LM. Grade II oligodendroglioma responds to chemotherapy. Neurology. 1996;46:203–207. - PubMed
-
- Leighton C, Fisher B, Bauman G, Depiero S, Stitt L, MacDonald D, Cairncross G. Supratentorial grade II glioma in adults: an analysis of prognostic factors and timing of radiation. J Clin Oncol. 1997;15:1289–1290. - PubMed
-
- Perry JR, Louis DN, Cairncross JG. Current treatment of oligodendrogliomas. Arch Neurol. 1999;56:434–436. - PubMed
-
- Sasaki H, Zlatescu MC, Betensky RA, Johnk LB, Cutone AN, Cairncross JG, Louis DN. Histopathological-molecular genetic correlations in referral pathologist-diagnosed grade II “oligodendroglioma”. J Neuropathol Exp Neurol. 2002;61:58–63. - PubMed
Grants and funding
LinkOut - more resources
Full Text Sources