. 2009 Nov 24:3:27.
doi: 10.3389/neuro.10.027.2009. eCollection 2009.

Multiquantal release underlies the distribution of synaptic efficacies in the neocortex

Affiliations

Multiquantal release underlies the distribution of synaptic efficacies in the neocortex

Alex Loebel et al. Front Comput Neurosci. .

Abstract

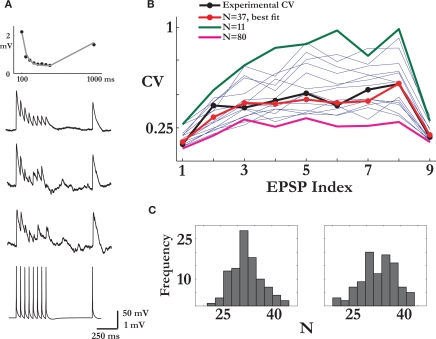
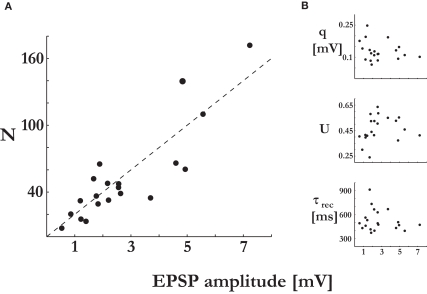
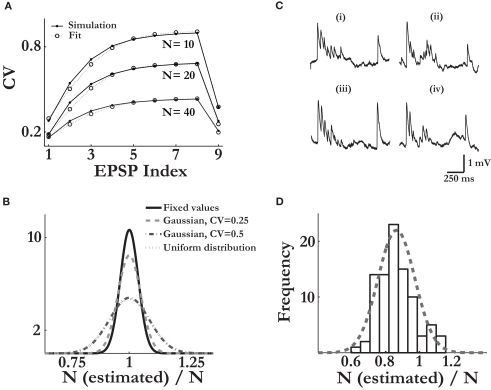
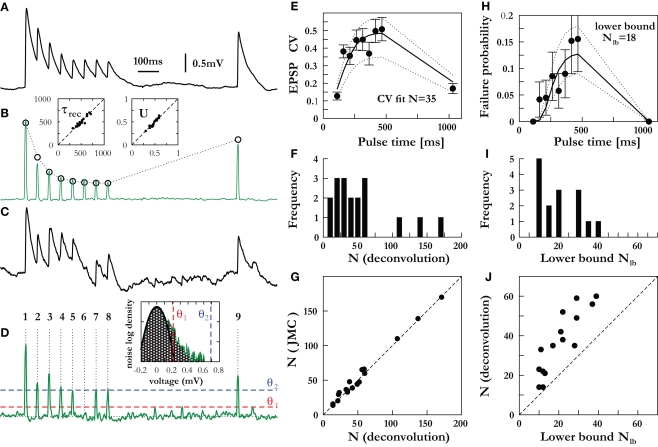
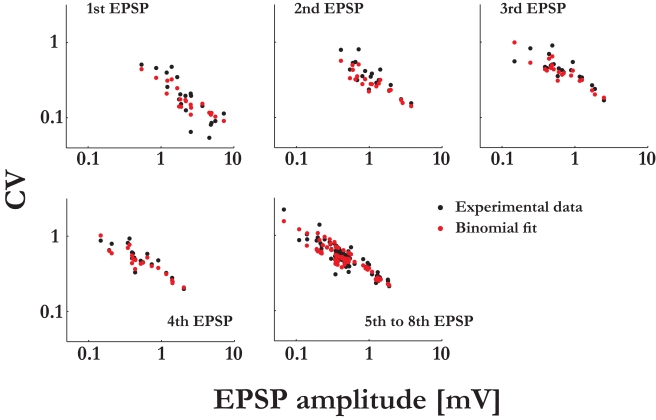
Inter-pyramidal synaptic connections are characterized by a wide range of EPSP amplitudes. Although repeatedly observed at different brain regions and across layers, little is known about the synaptic characteristics that contribute to this wide range. In particular, the range could potentially be accounted for by differences in all three parameters of the quantal model of synaptic transmission, i.e. the number of release sites, release probability and quantal size. Here, we present a rigorous statistical analysis of the transmission properties of excitatory synaptic connections between layer-5 pyramidal neurons of the somato-sensory cortex. Our central finding is that the EPSP amplitude is strongly correlated with the number of estimated release sites, but not with the release probability or quantal size. In addition, we found that the number of release sites can be more than an order of magnitude higher than the typical number of synaptic contacts for this type of connection. Our findings indicate that transmission at stronger synaptic connections is mediated by multiquantal release from their synaptic contacts. We propose that modulating the number of release sites could be an important mechanism in regulating neocortical synaptic transmission.

Keywords: neocortex; quantal analysis; short-term depression; synaptic transmission.


Figures

Figure 1
Figure 1
Estimating the number of release sites N. (A) Bottom to top: the pre-synaptic spike train, two examples of noisy post-synaptic single traces and the average response for that synaptic connection. The top panel shows the fit of the deterministic model of short-term synaptic depression (gray line) to the set of average EPSPs amplitudes (in black). (B) Estimation of N: the CVs of the nine EPSPs of the synaptic connection in (A) (black trace) were compared to the CVs calculated from the Monte Carlo simulations, each with a different value of N (thin blue traces). In the simulations, the parameters that govern the release process, the probability of release and the recovery time constant, were those estimated from the connection's average response. Here, the simulation with N = 37 resulted in the best fit (red trace). The x-axis labelling represents the nine synaptic responses along the spike train (the first eight) and the recovery test [the ninth EPSP; see in (A)]. (C) The histograms of the estimated number of release sites from a 100 repetitions of the procedure presented in (B), for two recordings of the synaptic connection in (A) taken 10 min apart. The mean of the right and left distributions were 32.8 and 33.3.
Figure 2
Figure 2
Synaptic efficacy is correlated with the number of release sites, but not with the probability of release or quantal size. The synaptic parameters were plotted vs. the EPSP amplitude of the connections’ response to the first stimulus of the input spike train. (A) The number of release sites, N, was significantly correlated to the EPSP amplitude (t-test, p < 0.00001). (B) The quantal size, q (t-test, p > 0.34), the probability of release, U (t-test, p > 0.38), and the recovery time constant, τrec (t-test, p > 0.4), were not correlated to the EPSP amplitude.
Figure 3
Figure 3
The estimation method is robust for various types of noise elements. Verifying the validity of the release-parameters uniformity assumption: (A) The analytically calculated CV values of the nine responses of three different virtual synapses, each with a different number of release sites (marked in figure) and with non-uniform sets of the release parameters (pi and τrec,i, i = 1…N; solid lines, Eq. 12); and the computed CV values of the corresponding three uniform synapses, in which the release parameters, U and τrec, were equal for all N release sites (dashed lines, Eq. 13). x-axis labelling represents the nine synaptic responses along the spike train. As in Figure 1B, the CV of the ninth EPSP is similar to that of the first EPSP, reflecting the recovery of the synaptic responses from depression (e.g. Figure 1A). The pi and τrec,i were drawn from a Gaussian distribution with the standard deviation half the value of the mean. (B) 500 virtual synapses were simulated for each of the distributions of the release parameters considered. With the calculated uniform release parameters for each synapse, U and τrec, Eq. 12 was fitted to Eq. 11 to produce an estimated value of N. The distributions of the ratio of the estimated value and the true value of N are shown for the cases in which pi and τrec,i were fixed for all release sites; were drawn from a narrow Gaussian distribution (standard deviation was 0.25 of the mean); a wide Gaussian distribution (standard deviation was 0.5 of the mean); and from a uniform distribution [with boundaries of (0.05 0.95) for pi, and 50 ms 1200 ms for τrec,i]. Simulations of realistic synaptic connections: (C) Examples of simulated single traces, in which various sources of synaptic variability were considered and background slice activity was added, (iii) and (iv) (see Materials and Methods); compared to single traces recorded in experiment, (i) and (ii). The values of the synaptic parameters in the simulated traces were similar to the values estimated for the measured synaptic connection. (D) Estimating the number of release sites from the simulations of the noisy synaptic connections reveals a slight bias toward lower values than the true number of release sites considered. The broken-line curve represents the best Gaussian fit with 0.88 ± 0.1 (mean ± std). In the simulations, the values of N were either 10, 20, 30, 40 or 80, and the release parameters were drawn from the wide Gaussian distribution (see B, Materials and Methods).
Figure 4
Figure 4
Direct amplitude measurement using voltage deconvolution. Mean-variance estimation for N and its lower bound from failure analysis. (A) The average voltage trace for an example connection, (B) and its corresponding deconvolved trace (membrane filter constant τmem = 42 ms). The fit (dotted line) to the deterministic synaptic depression model (Eq. 18) yields τrec = 390 ms, U = 0.51 and A = q·N = 4.1 mV. Insets compare the fit parameters τrec and U (deconvolution method x-axis, JMC method y-axis) showing excellent agreement between the distinct approaches to amplitude measurement. (C) An example of one of the experimental single traces of the connection in (A), (D) and its deconvolution. The inset shows the distribution of background noise (required for the failure analysis – see Materials and Methods) measured between pulse 8 and 9 during all single traces. The distribution is part Gaussian (fit, black line) with a tail at higher voltages due to spontaneous EPSPs. An amplitude below θ1 = 0.22 mV (red dashed line) is considered a failure, an amplitude between θ1 and θ2 = 0.69 mV (blue dashed line) adds an amount ps to the failure count, and amplitudes above θ2 are not considered a failure (see Materials and Methods for further details). (E) Estimation of N via a fit to the CV (bold lines) for this connection with the CVs for N ± 10 (dotted lines) shown for comparison, (F) and the histogram of N for all connections, with the average equal to 53.8. (G) Comparison with the JMC approach, showing close agreement between the different methods of mean-variance measurement. (H) Fit to the failure probability for the connection in (A–E), giving a conservative lower bound Nlb = 18. The failure probabilities for Nlb ± 3 (dotted lines) are shown for comparison. (I) Distribution of lower bounds for all connections analyzed with the failure analysis, with the average Nlb value of 20.8 (J) and their comparison to estimated number of release sites from the CV analysis.
Figure 5
Figure 5
The extended binomial model captures the relation between the CVs and the EPSP amplitudes over the whole range of amplitudinal response. The CVs of the synaptic responses from the 20 connections were plotted vs. their mean EPSP amplitudes (on a log-log scale, black dots), grouped by the stimulus’ index along the pre-synaptic spike train. In red are the corresponding CVs as predicted by the extended binomial model: CVμ=1/Mμq(1Uμ), where M is the EPSP amplitude as measured in experiments, q is the computed quantal size and Uμ = U·ρμ is the effective probability of release for the μth response (with ρ1 = 1, see Eq. 14).
Figure 6
Figure 6
Reliability of synaptic connections increases with their response amplitude. Four typical single traces from one of the strongest and highly reliable synaptic connection measured (A), and one of the weakest and noisiest connection recorded (B). The estimated numbers of release sites were 110 and 15, respectively. Arrows mark few of the response failures for the weaker connection. No failures were observed in any of the single traces recorded for the connection in A (>400 PSP's). Other synaptic parameters were similar: release probability 0.46 vs. 0.39; recovery time constant 398 ms vs. 461 ms; and quantal size 0.12 mV vs. 0.19 mV.

References

    1. Abbott L. F., Varela J. A., Sen K., Nelson S. B. (1997). Synaptic depression and cortical gain control. Science 275, 220–22410.1126/science.275.5297.221 - DOI - PubMed
    1. Biró A. A., Holderith N. B., Nusser Z. (2005). Quantal size is independent of the release probability at hippocampal excitatory synapses. J. Neurosci. 25, 223–23210.1523/JNEUROSCI.3688-04.2005 - DOI - PMC - PubMed
    1. Biró A. A., Holderith N. B., Nusser Z. (2006). Release probability-dependent scaling of the postsynaptic responses at single hippocampal GABAergic synapses. J. Neurosci. 26, 12487–1249610.1523/JNEUROSCI.3106-06.2006 - DOI - PMC - PubMed
    1. Brémaud A., West D. C., Thomson A. M. (2007). Binomial parameters differ across neocortical layers and with different classes of connections in adult rat and cat neocortex. Proc. Natl. Acad. Sci. U.S.A. 104, 14134–1413910.1073/pnas.0705661104 - DOI - PMC - PubMed
    1. Christie J. M., Jahr C. E. (2006). Multivesicular release at Schaffer collateral-CA1 hippocampal synapses. J. Neurosci. 26, 210–21610.1523/JNEUROSCI.4307-05.2006 - DOI - PMC - PubMed

LinkOut - more resources