. 2009:2009:356141.
doi: 10.1155/2009/356141. Epub 2009 Oct 11.

Analysis of High-Throughput Flow Cytometry Data Using plateCore

Affiliations

Analysis of High-Throughput Flow Cytometry Data Using plateCore

Errol Strain et al. Adv Bioinformatics. 2009.

Abstract

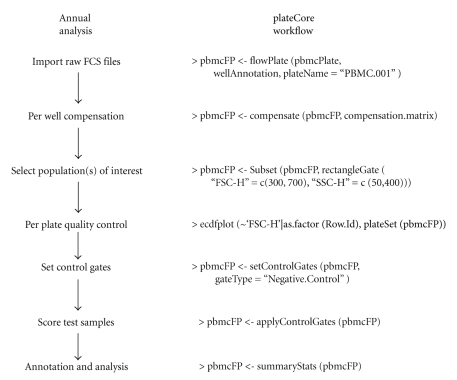
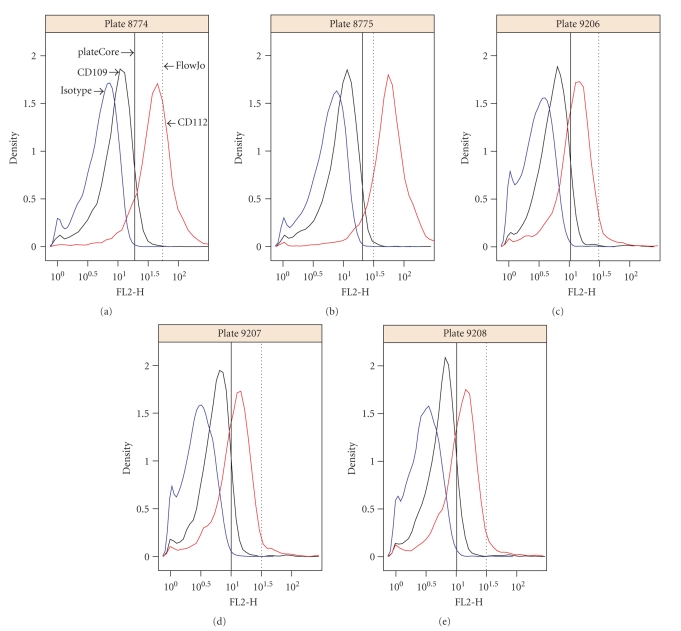
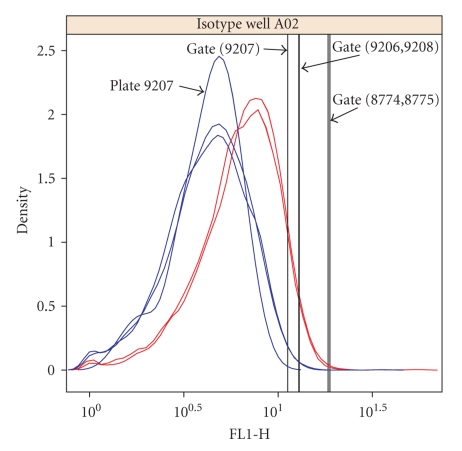
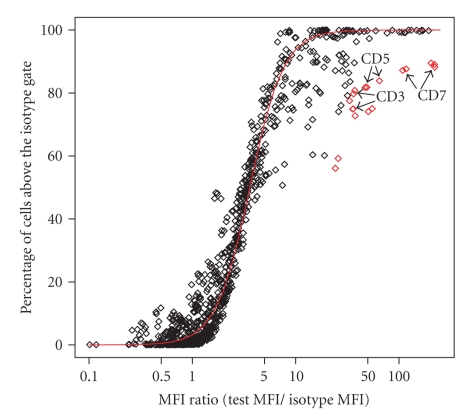
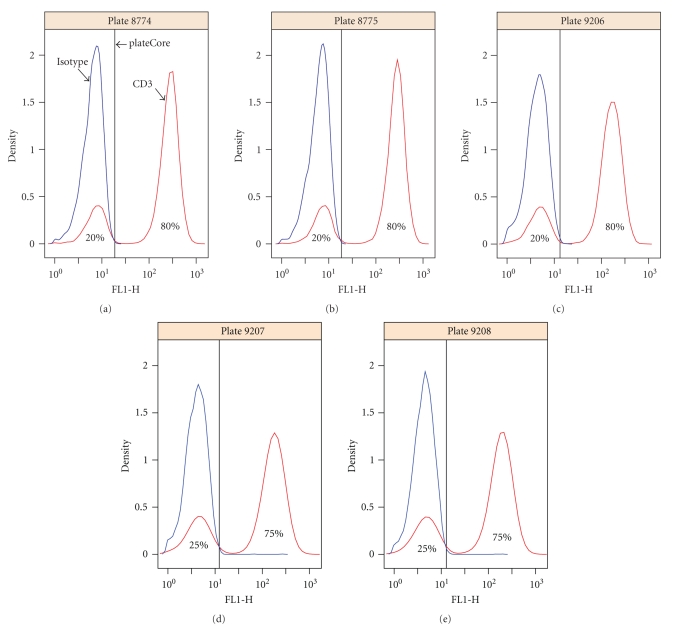
Flow cytometry (FCM) software packages from R/Bioconductor, such as flowCore and flowViz, serve as an open platform for development of new analysis tools and methods. We created plateCore, a new package that extends the functionality in these core packages to enable automated negative control-based gating and make the processing and analysis of plate-based data sets from high-throughput FCM screening experiments easier. plateCore was used to analyze data from a BD FACS CAP screening experiment where five Peripheral Blood Mononucleocyte Cell (PBMC) samples were assayed for 189 different human cell surface markers. This same data set was also manually analyzed by a cytometry expert using the FlowJo data analysis software package (TreeStar, USA). We show that the expression values for markers characterized using the automated approach in plateCore are in good agreement with those from FlowJo, and that using plateCore allows for more reproducible analyses of FCM screening data.


Figures

Figure 1
Figure 1
Typical FC-HCS plate workflow on the left and corresponding steps from a PBMC lymphocyte plateCore analysis on the right.
Figure 2
Figure 2
FlowJo estimates for the percentage of cells above the isotype threshold for 189 markers on replicate plates for donor 1 and donor 2. Estimates from markers where the center of the cell population was near the isotype threshold, around 50%, were more variable than samples which were clearly positive (≥99%) or negative (≤1%). The correlation for replicate plates was strong in both donors, with donor 1 at 0.92 and donor 2 at 0.98. Plate 9208 for donor 2 is not shown, since the results are very similar to 9206 and 9207.
Figure 3
Figure 3
Plot showing the percentage of cells above the isotype threshold from plateCore (x-axis) and FlowJo (y-axis) for each of the 189 markers on the 5 PBMC plates. If the two methods produce similar estimates, then the values should be near the red line (y = x). In plateCore the isotype threshold was determined using only information from the isotype control well, while the threshold in FlowJo may be adjusted after identifying either positively or negatively staining test samples. Generally, these FlowJo adjustments resulted in the isotype gate being set a higher level to exclude a negative test sample. The effect of increasing the isotype threshold can be seen in these plots, where most disagreements are cases where plateCore estimates are higher than FlowJo. Detailed plots for one marker, CD112 (red diamond), where the two methods give different results are shown in Figure 5.
Figure 4
Figure 4
Plot showing the percentage of cells above the isotype threshold from plateCore (x-axis) and FlowJo (y-axis) for donor 1 (red) and 2 (blue) in channels FL1-H through FL4-H. plateCore gating for Phycoerythrin (PE) conjugated antibodies (FL2-H) was consistently lower than FlowJo, resulting in more cells above the isotype gate.
Figure 5
Figure 5
Density plots showing the plateCore (solid black) and FlowJo (dashed black) isotype gates for CD112 and CD109, which shared the same isotype control (IgG1-PE). The plateCore and FlowJo analyses gave different estimates for CD112 (see Figure 3), which was caused by the gate being moved higher in FlowJo based on the presumed negative staining for CD109.
Figure 6
Figure 6
Density plot showing an example of one case where the isotype (IgG1-Alexa 488) gate settings differed between replicate plates for donor 2 (blue). In this case, the low setting for plate 9207 did not result in a significant difference between plates for the percentage of cells above the gate in the corresponding test well (CXCR5), so the gate was not modified. Plates 9206, 9207, and 9208 had 14%, 16%, and 15% percent of cells above the gate, respectively.
Figure 7
Figure 7
Quality of the automated gating was assessed by performing a robust logistic regression of the percentage of cells above the isotype gate on the log transformed MFI ratio and looking for estimates that were more than 2 standardized residuals away from the best fit line (red line). There were 18 estimates flagged in this study (red diamonds) where the value was different than we would predict from the MFI ratio. Detailed examination of these 18 cases showed that the isotype gate settings were reasonable, but they differed from other markers in that they had more than one population of stained cells. Sample density plots for one of these markers, CD3, are provided in Figure 8.
Figure 8
Figure 8
Density plot for CD3 (IgG1-Alexa 488), which was flagged for further evaluation by our gating quality assessment (Figure 7). The isotype gate settings look reasonable; however the MFI ratio for CD3 was very different from other markers that also had 75%–80% of their cells above the isotype gate. Looking at Figure 7, other markers with 75%–80% had MFI ratios near 5, while CD3 has an MFI ratio of 31–37. The flagging was the result of 2 cell populations for CD3, whereas most other markers stain a single population.

References

    1. Gasparetto M, Gentry T, Sebti S, et al. Identification of compounds that enhance the anti-lymphoma activity of rituximab using flow cytometric high-content screening. Journal of Immunological Methods. 2004;292(1-2):59–71. - PubMed
    1. Brinkman RR, Gasparetto M, Lee S, et al. High-content flow cytometry and temporal data analysis for defining a cellular signature of graft-versus-host disease. Biology of Blood and Marrow Transplantation. 2007;13(6):691–700. - PMC - PubMed
    1. Gentleman R, Carey VJ, Bates DM, et al. Bioconductor: open software development for computational biology and bioinformatics. Genome Biology. 2004;5(10, article R80) - PMC - PubMed
    1. Maecker HT, Rinfret A, D'Souza P, et al. Standardization of cytokine flow cytometry assays. BMC Immunology. 2005;6, article 13 - PMC - PubMed
    1. Hahne F, Le Meur N, Brinkman RR, et al. flowCore a bioconductor package for high throughput flow cytometry. BMC Bioinformatics. 2009;10(1, article 106) - PMC - PubMed

LinkOut - more resources