. 2009 Nov 30;4(11):e7935.
doi: 10.1371/journal.pone.0007935.

Positive regulatory control loop between gut leptin and intestinal GLUT2/GLUT5 transporters links to hepatic metabolic functions in rodents

Affiliations

Positive regulatory control loop between gut leptin and intestinal GLUT2/GLUT5 transporters links to hepatic metabolic functions in rodents

Yassine Sakar et al. PLoS One. .

Abstract

Background and aims: The small intestine is the major site of absorption of dietary sugars. The rate at which they enter and exit the intestine has a major effect on blood glucose homeostasis. In this study, we determine the effects of luminal leptin on activity/expression of GLUT2 and GLUT5 transporters in response to sugars intake and analyse their physiological consequences.

Methodology: Wistar rats, wild type and AMPKalpha(2) (-/-) mice were used. In vitro and in vivo isolated jejunal loops were used to quantify transport of fructose and galactose in the absence and the presence of leptin. The effects of fructose and galactose on gastric leptin release were determined. The effects of leptin given orally without or with fructose were determined on the expression of GLUT2/5, on some gluconeogenesis and lipogenic enzymes in the intestine and the liver.

Principal findings: First, in vitro luminal leptin activating its receptors coupled to PKCbetaII and AMPKalpha, increased insertion of GLUT2/5 into the brush-border membrane leading to enhanced galactose and fructose transport. Second in vivo, oral fructose but not galactose induced in mice a rapid and potent release of gastric leptin in gastric juice without significant changes in plasma leptin levels. Moreover, leptin given orally at a dose reproducing comparable levels to those induced by fructose, stimulated GLUT5-fructose transport, and potentiated fructose-induced: i) increase in blood glucose and mRNA levels of key gluconeogenesis enzymes; ii) increase in blood triglycerides and reduction of mRNA levels of intestinal and hepatic Fasting-induced adipocyte factor (Fiaf) and iii) increase in SREBP-1c, ACC-1, FAS mRNA levels and dephosphorylation/activation of ACC-1 in liver.

Conclusion/significance: These data identify for the first time a positive regulatory control loop between gut leptin and fructose in which fructose triggers release of gastric leptin which, in turn, up-regulates GLUT5 and concurrently modulates metabolic functions in the liver. This loop appears to be a new mechanism (possibly pathogenic) by which fructose consumption rapidly becomes highly lipogenic and deleterious.


Conflict of interest statement

Competing Interests: The authors have declared that no competing interests exist.

Figures

Figure 1
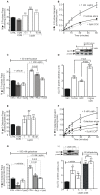
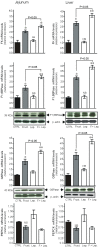
Figure 1. Luminal leptin increases GLUT2 and GLUT5 transport activities.
Dose-response effect for luminal leptin stimulation of mucosal (M) to serosal (S) fructose [30 mM, (1, A)] or galactose [100 mM, (1, E)] transepithelial transport in the isolated rat jejunal loops in vitro. CCK8 (8 pM) was added to the serosal side. Data are expressed as apparent permeability (Papp) and each column represents the mean±SEM of n = 6 rats. B, F, Kinetic of luminal leptin stimulation of fructose (B) or galactose (F) transport in the isolated rat jejunal loops in vitro. CCK8 (8 pM) was added in the incubation medium (serosal side). C, G, Effects of phloretin (PHLO, 1 mM) and cytochalasin B (CytoB, 20 µM), two GLUT2 inhibitors, on basal and leptin-induced mucosal to basolateral fructose (C) and galactose (G) transport in the isolated rat jejunal loops in vitro. Data are expressed as apparent permeability (Papp) and each column represents the mean±SEM of n = 8 rats. D, H, Representative immunoblots of GLUT5, GLUT2 and β-actin proteins in brush-border membranes from rat jejunum treated with or without luminal leptin in association with or without fructose (30 mM) and galactose (100 mM) into the isolated jejunal loop. Results of densitometric analysis are expressed as relative protein levels. *P<0.05; **P<0.01,*** P<0.001 vs. NaCl.
Figure 2
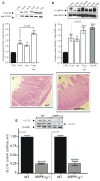
Figure 2. Actions of leptin require active jejunal leptin receptors.
Effects of a leptin receptor antagonist, L39A/D40A/F41A mutein on basal and luminal leptin-stimulated mucosal to serosal D-galactose (A) and D-fructose (B) transport across the rat jejunum. Shown are apparent permeability (Papp) of galactose and fructose across the jejunum. Each column represents mean±SEM for n = 6 rats. Statistical analysis was performed using One-way ANOVA followed by a Tukey Kramer multiple comparisons *P<0.05, ***P<0.001 vs. control. (C) Leptin receptors in the jejunum mucosa are functional. Shown are representative immunoblots (4 separate experiments) of phosphorylated ERK-1/2 and total ERK proteins in extracts from isolated jejunum treated with luminal leptin or fructose or both in association. The introduction of leptin into jejunum increased phosphorylation of ERK-1/2. Luminal fructose also increased phosphorylation of ERK-1/2, an effect that was further enhanced by leptin. AICAR, the pharmacological activator of AMPK increased the phosphorylation ERK-1/2.
Figure 3
Figure 3. Luminal leptin phosphorylates PKCβII and AMPKα in the jejunum.
A, A representative immunoblot (5 different preparations of BBM) of phosphorylated and total PKCβII from rat jejunum loops treated with or without luminal leptin in association with or without 30 mM fructose. The data of densitometric analysis of the blots are expressed as a ratio of phosphorylated PKCβII to total PKCβII. B, a representative immunoblot (4 separate experiments) of phosphorylated and total AMPK from mucosa extracts of rat jejunum loops incubated with or without (CTRL) 1 nM leptin in association without or with 30 mM fructose. 5-aminoimidazole-4-carboxamide riboside (2.5 mM AICAR) was used as control. Data of densitometric analysis are expressed as a ratio of phosphorylated AMPKα to total AMPK. *P<0.05, ** P<0.01 and *** P<0.001 vs. CTRL. C, D, histological analysis of jejunum sections from AMPKα2−/− and WT mice stained with hematoxylin-eosin (scale bar = 20 µm). E, representative immunoblots of GLUT2 and GLUT5 proteins in extracts from jejunum mucosa from AMPKα2−/− and WT mice. Data of densitometric analysis of the blots are expressed as relative protein levels. Each column represent the mean±SEM of n = 5 mice in each group. *** P<0.001 vs WT.
Figure 4
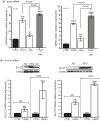
Figure 4. Acute and chronic leptin administration increase basal and fructose-stimulated GLUT2 and GLUT5 mRNA.
A, for acute studies, 16-hour deprived fasted mice receiving oral administration of saline (CTRL), 3 ng/g murine leptin, fructose (2 g/kg) or fructose in combination with leptin. They were sacrified 4 hours later, and total RNA was extracted from the jejunum mucosa for qRT-PCR analysis in duplicate using specific oligonucleotides for GLUT2 and GLUT5 genes. Results are means±SEM for 8 mice in each group. B, for chronic studies, mice fed a standard diet (SD) or a high-calorie diet (HFD), received saline (CTRL) or 3 ng/g leptin, administered daily by gavage for 7 days. Mice were killed on day 8 and total RNA was extracted from jejunum mucosa for qRT-PCR analysis. Results are means±SEM for 8 mice in each study and each group. * P<0.05; ** P<0.01 and *** P<0.001 vs CTRL. B insert, representative immunoblots of GLUT2 and GLUT5 proteins from jejunum extracts of mice fed a SD and a high-calorie diet (HFD) showing increased amount GLUT2 and GLUT5 proteins when mice were fed a HFD in comparison to those fed a SD.
Figure 5
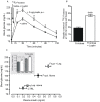
Figure 5. Luminal leptin increases fructose-induced hyperglycaemia and hepatic content of fructose.
Changes in plasma glucose levels (A) and in hepatic content of fructose (B). A solution of fructose (2 g/kg) containing radiolabelled [14C]-fructose was given by gavage without (control) or with 3 ng/g leptin to 16-hour fasted mice. Before starting the oral fructose tolerance test (OFTT), blood samples were taken from the tail and glucose levels was determined using Accu-Chek. At 120 minutes, the radioactivity in liver was counted and used to calculate the hepatic content fructose. C, changes in blood glucose levels as a function of plasma insulin levels. Fifteen minutes after oral administration of fructose (2 g/kg) without (control) or with 3 ng/g leptin to 16-hour fasted mice, blood was collected as described in Materials and Methods for determination of plasma glucose and insulin levels. C insert, are the measured area under curves at time 60 min after oral load of fructose (1 or 2 g/kg) without or with 3 ng/g leptin. Each column represents the mean±SEM of n = 8 mice for saline and leptin, n = 12 for each amount of fructose and fructose+leptin. * P<0.05 vs. saline; # P<0.05 vs fructose.
Figure 6
Figure 6. Leptin given orally potentiates fructose-induced mRNA levels of enzymes involved in glucose metabolism in intestine and the liver.
Total RNA was extracted from jejunum mucosa and the liver, 4 hours after oral administration of saline (CTRL) or 3 ng/g leptin, oral fructose (2 g/kg) or both, in fasted mice. Q-RT PCR analysis was performed in duplicate using specific oligonucleotides for fructokinase, F1,6BPase, G6Pase and PEPCK genes, left columns: jejunum, right columns: liver. Inserts are representative immunoblots of F1,6BPase, glucose-6-phosphatase (G6Pase). Results are means±SEM for 6 mice in each group. * P<0.05 and ** P<0.01 vs. CTRL.
Figure 7
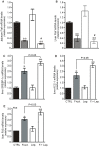
Figure 7. Changes in Fiaf, hepatic SREBP-1c, ACC-1 and FAS mRNA in response to oral administration of fructose or leptin or both.
Total RNA was extracted from jejunum mucosa and the liver, 4 hours after oral administration of saline (CTRL), leptin (3 ng/g), oral fructose (2 g/kg) or both, in fasted mice. QRT-PCR analysis was performed in duplicate using specific oligonucleotides targeting genes encoding (A, B) fasting-induced adipocyte factor (Fiaf), (C) liver SREBP-1c, (D) liver ACC-1 and (E) liver FAS. Results are means±SEM for 6 mice in each group are expressed as mRNA levels relative expression. * P<0.05; ** P<0.01 vs CTRL.
Figure 8
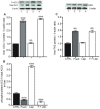
Figure 8. Changes in hepatic ACC-1 and FAS proteins in response to fructose, leptin or both given orally.
Proteins were extracted from jejunum mucosa and the liver, 4 hours after oral administration of saline, leptin (3 ng/g), oral fructose (2 g/kg) or both, in fasted mice. Representative immunoblots of phosphorylated ACC-1, total ACC-1, FAS and β-actin protein in liver extracts. Lane 1: control; lane 2: Fructose 2 g/kg: lane 3: leptin 3 ng/g; lane 4: fructose in combination with leptin. Results of densitometric analysis are expressed as mean±SEM of 6 mice in each group. ** P<0.01 and *** P<0.01 vs. CTRL.
Figure 9
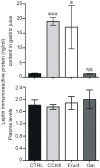
Figure 9. Release of leptin in gastric juice in response to oral load of fructose or galactose.
Changes in the amount of leptin released in the gastric juice and in plasma in mice fasted overnight and receiving an oral load of saline (CTRL), fructose [Fruct. 2 g/kg)], galactose (Gal. 6 g/kg) or intraperitoneal injection of 10 ng/g CCK-8. Leptin immunoreactivity was determined by RIA in 15-min collected juice from the stomach as described in Materials & Methods. Data are expressed as the mean±SEM of n = 6 in control group and n = 5 in each other group. *P<0.05 and ***P<0.01 vs CTRL.
Figure 10
Figure 10. Schematic view of the regulatory control loop between gut leptin and fructose transporters.
Ingestion of fructose increased the release of gastric leptin which enters together with fructose the intestine. The concentrations of leptin detected in intestinal juice are suitable with activation of leptin receptors. This luminal leptin operates through leptin receptor (Ob-R) to increase the clearance of fructose from the intestinal lumen predominantly via the brush border GLUT5 transporter. Fructose and glucose exit the enterocyte through the basolateral GLUT2 transporter into the blood and are delivered to various organs including the liver. Fructose enters into the liver, induces SREBP-1c a transcription factor targeting genes in the lipogenic program. This cluster of events which are amplified by gut leptin is likely to provide the mechanism for rapidly acquired adiposity. FK: fructokinase, G6Pase: glucose-6-phosphatase, Fiaf: Fasting-induced adipocyte factor, TG triglycerides, SBREP-1c: Sterol Regulatory Element Binding Protein-1c; ACC-1 Acetyl-coA Carboxylase isoform 1, FAS, fatty acid synthase.

Similar articles

Cited by

References

    1. Kellett GL, Brot-Laroche E. Apical GLUT2: a major pathway of intestinal sugar absorption. Diabetes. 2005;54:3056–3062. - PubMed
    1. Kellett GL, Helliwell PA. The diffusive component of intestinal glucose absorption is mediated by the glucose-induced recruitment of GLUT2 to the brush-border membrane. Biochem J. 2000;350 Pt 1:155–162. - PMC - PubMed
    1. Barone S, Fussell SL, Singh AK, Lucas F, Xu, et al. Slc2a5 (Glut5) is essential for the absorption of fructose in the intestine and generation of fructose-induced hypertension. J Biol Chem. 2009;284:5056–5066. - PMC - PubMed
    1. Ferraris RP. Dietary and developmental regulation of intestinal sugar transport. Biochem J. 2001;360:265–276. - PMC - PubMed
    1. Ishikawa Y, Eguchi T, Ishida H. Mechanism of beta-adrenergic agonist-induced transmural transport of glucose in rat small intestine. Regulation of phosphorylation of SGLT1 controls the function. Biochim Biophys Acta. 1997;1357:306–318. - PubMed

Publication types