. 2009 Dec 2;4(12):e8023.
doi: 10.1371/journal.pone.0008023.

Interaction of vitamin D receptor with HLA DRB1 0301 in type 1 diabetes patients from North India

Affiliations

Interaction of vitamin D receptor with HLA DRB1 0301 in type 1 diabetes patients from North India

Neetu Israni et al. PLoS One. .

Abstract

Background: Type 1 diabetes (T1D) is a multifactorial autoimmune disorder where interaction and integration of immune response genes along with environmental factors play a role in autoimmune destruction of the insulin producing Pancreatic Beta cells.

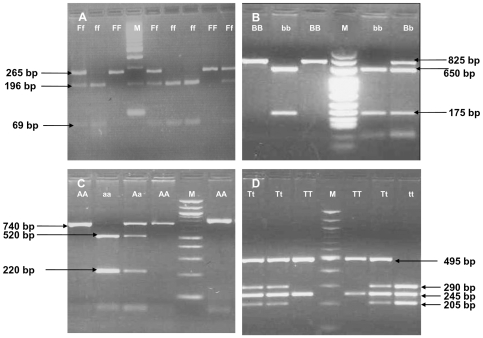
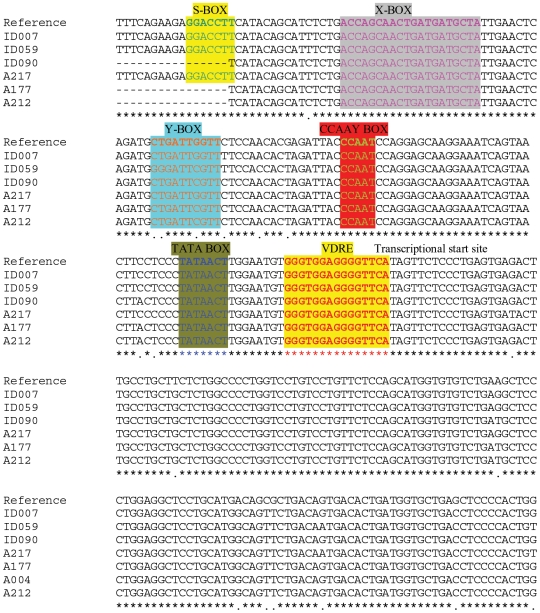
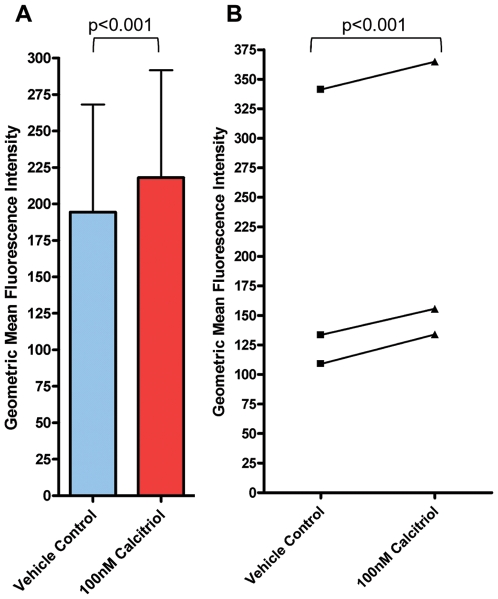
Methodology/principal findings: We have studied four single nucleotide polymorphisms (FokI site in Exon 2, BsmI and ApaI sites in Intron 8 and TaqI site in exon 9) in the vitamin D receptor (VDR) gene using PCR-RFLP and HLA-DRB1 alleles using PCR and hybridization with sequence specific oligonucleotide probes and studied their interaction using LD based statistics for non-linked loci followed by sequence analysis of the vitamin D response element (VDRE) present in the promoter region of HLA-DRB1 0301. Haplotypes, constructed using SHEsis program for four single nucleotide polymorphisms in the VDR gene, were studied for their interaction with HLA-DRB1 alleles in 233 T1D patients and 191 healthy controls from North India. A significant increase of haplotypes FBAt and fBAT (p<0.02, OR = 1.44 and p<0.002, OR = 3.23 respectively) was observed in the patients. Both the haplotypes FBAt and fBAT were significantly increased in male patients with age at onset less than 18 years; however, fBAT was significantly increased in female patients irrespective of their age at onset. LD based statistics showed significant interaction between the high producer F and T alleles with HLA-DRB1 0301. F and T alleles of VDR have been shown to contribute to VDR mRNA independently. The promoter sequence analysis of HLA-DRB1 0301 showed presence of VDRE involved in higher expression of HLA-DRB1 030, which was confirmed by flow cytometry and real time PCR analysis.

Conclusions/significance: These data suggest that the interaction between VDR and HLA alleles is mediated by VDRE present in the promoter region of HLA-DRB1 0301 allele, which may be detrimental for the manifestation of T1D in the absence of 1,25-(OH)(2)D(3) in early childhood due to poor expression of DRB1 0301 in the thymus resulting in autoimmunity.


Conflict of interest statement

Competing Interests: The authors have declared that no competing interests exist.

Figures

Figure 1
Figure 1. The genotypes for the four SNPs were determined by PCR amplification and restriction digestion of the PCR products with enzymes FokI, BsmI, ApaI, and TaqI.
A: Fok1 digestion: SNP C/T in exon 2 was studied by amplifying a 265 bp fragment using primers 5′AGCTGGCCCTGGCACTGACTCTTGCTCT 3′ and 5′ATGGAAACACCTTGCTTCTTCTCCCTC 3′ with 68°C as annealing temperature and digestion by fok1 at 37°C for 3 hours. Presence of restriction site is denoted by ‘f’ while absence of restriction is denoted by ‘F’. Results show FF (CC) i.e., a 265 bp band or Ff (CT) i.e., 265 bp, 196 bp and 69 bp, bands, ff (TT) i.e., 196 bp and 69 bp bands. M is the100 bp ladder. B: Bsm 1 digestion: SNP A/G in Intron 8 was studied by amplifying an 825 bp fragment using primers 5′CAACCAAGACTACAAGTACCGCGTCAGTGA 3′ and 5′AACCAGCGGGAAGAGGTCAAGGG 3′ with 65°C as annealing temperature and digestion by Bsm1 at 65°C for one hour. Presence of restriction site is denoted as ‘b’ and absence of restriction is denoted by ‘B’. The results show BB (AA) i.e., 825 bp band, Bb (AG) i.e., 825 bp, 650 bp and 175 bp and bands and bb (GG) 650 bp and 175 bp bands. M is 25 bp ladder. C: Apa 1 digestion: SNP T/G in Intron 8 was studied by amplifying an 740 bp fragment using primers 5′ CAGAGCATGGACAGGGAGCAAG 3′ and 5′ GCAACTCCTCATGGCTGAGGTCTCA 3′ with 65°C as annealing temperature and digestion by Apa1 at 37°C for one hour. Presence of restriction site is denoted as ‘a; and absence of restriction is denoted by ‘A’. The results show AA (TT) i.e., 740 bp band, Aa (TG) i.e., 740 bp, 520 bp and 220 bp bands and aa (GG) 520 bp and 220 bp bands. M is 100 bp ladder. D: Taq 1 digestion: SNP T/C in exon 9 was studied by amplifying an 740 bp fragment using primers 5′CAGAGCATGGACAGGGAGCAAG 3′ and 5′GCAACTCCTCATGGCTGAGGTCTCA 3′ with 65°C as annealing temperature and digestion by Taq1 at 65°C for one hour. Presence of restriction site is denoted as ‘t’ and absence of restriction is denoted by ‘T’. The results show TT (TT) i.e., 495 bp and 245 bp bands Tt (TC) i.e., 495 bp, 290 bp, 245 bp and 205 bp bands and tt (CC) 290 bp, 245 bp and 205 bp bands. M is 100 bp ladder.
Figure 2
Figure 2. Promoter region of HLA- DRB1 was sequenced from 3 subjects suffering from type 1 diabetes and 3 normal healthy individuals homozygous for DRB1*0301.
The sequence showing important regulatory elements like S-box, X-box, Y-box, CCAAY-box, TATA-box and VDRE are highlighted. Stars (*) in the last row show homology and dots (.) show nucleotide substitution in one or more samples at that particular site and dashes(-) represent gaps inserted to maximize the homology. The ID and A numbers represent the T1D and control samples sequenced respectively. The sequences have been aligned with reference sequence gi|545423|gb|S69987.1| HLA-DRB1 (DRB1*0301) {promoter} [human, lymphoblastoid cell line AVL, Genomic, 416 nt] .
Figure 3
Figure 3. Flow cytometric analysis of HLA-DR expression.
B-LCLs VAVY and DUCAF cells were treated with 100 nM calcitriol or equal volume of alcohol as vehicle control. Both VAVY and DUCAF cells show a significant increase in surface HLA-DR expression as determined by the geometric mean flurescence intensity of staining with HLA-DR-PE antibody. A. The figure shows mean±S.E.M. of three independent experiments. Two tailed Paired T test shows the difference to be significant with p<0.001 i.e., enhanced expression of HLA-DR in B-LCLs treated with calcitriol as compared to untreated ones. B: Line graph showing the extent of enhanced HLA-DR expression in three independent expeiments.

Similar articles

Cited by

References

    1. Ramachandran A, Snehalatha C, Krishnaswamy CV. Incidence of IDDM in children in urban population in southern India. Madras IDDM Registry Group Madras, South India. Diabetes Res Clin Pract. 1996;34:79–82. - PubMed
    1. Rani R, Sood A, Goswami R. Molecular basis of predisposition to develop type 1 diabetes mellitus in North Indians. Tissue Antigens. 2004;64:145–155. - PubMed
    1. Kumar R, Goswami R, Agarwal S, Israni N, Singh SK, et al. Association and interaction of the TNF-alpha gene with other pro- and anti-inflammatory cytokine genes and HLA genes in patients with type 1 diabetes from North India. Tissue Antigens. 2007;69:557–567. - PubMed
    1. Evans RM. The steroid and thyroid hormone receptor superfamily. Science. 1988;240:889–895. - PMC - PubMed
    1. Boonstra A, Barrat FJ, Crain C, Heath VL, Savelkoul HF, et al. 1alpha,25-Dihydroxyvitamin d3 has a direct effect on naive CD4(+) T cells to enhance the development of Th2 cells. J Immunol. 2001;167:4974–4980. - PubMed

Publication types

MeSH terms