

Examination of genome homogeneity in prokaryotes using genomic signatures
- PMID: 19956556
- PMCID: PMC2781299
- DOI: 10.1371/journal.pone.0008113
Examination of genome homogeneity in prokaryotes using genomic signatures
Abstract
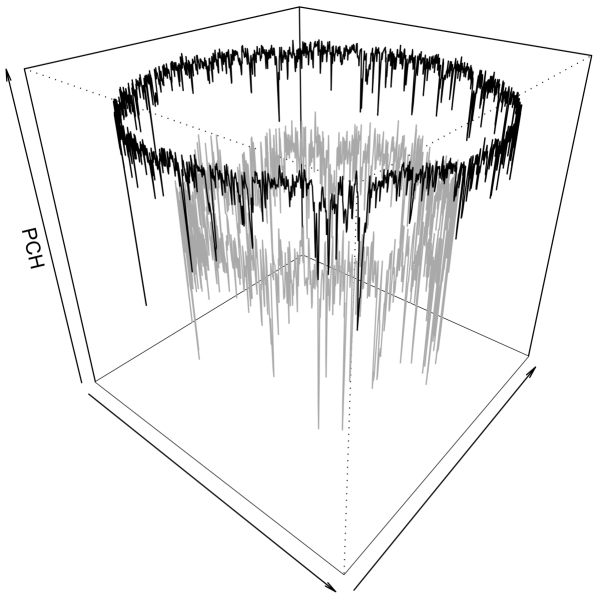
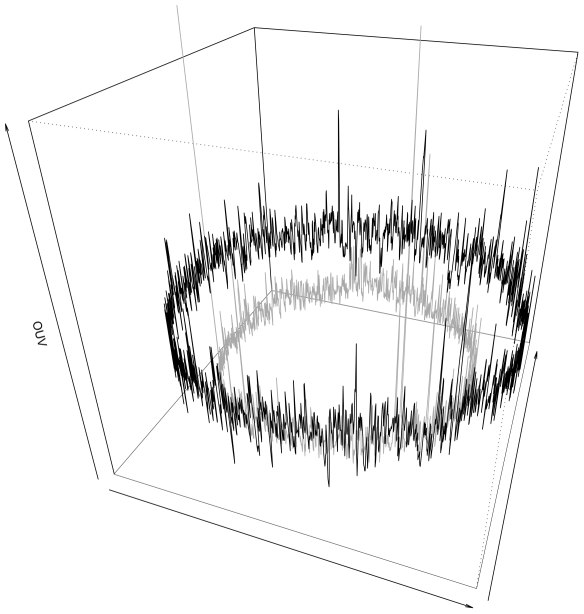
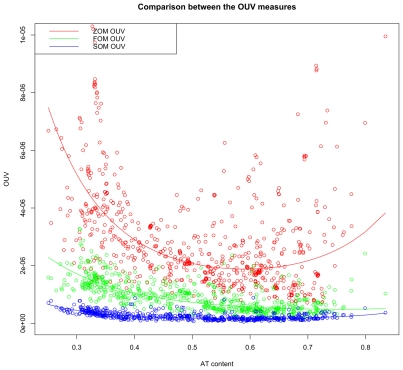
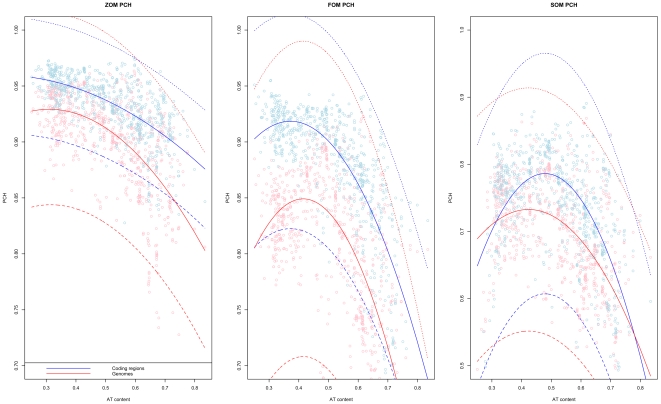
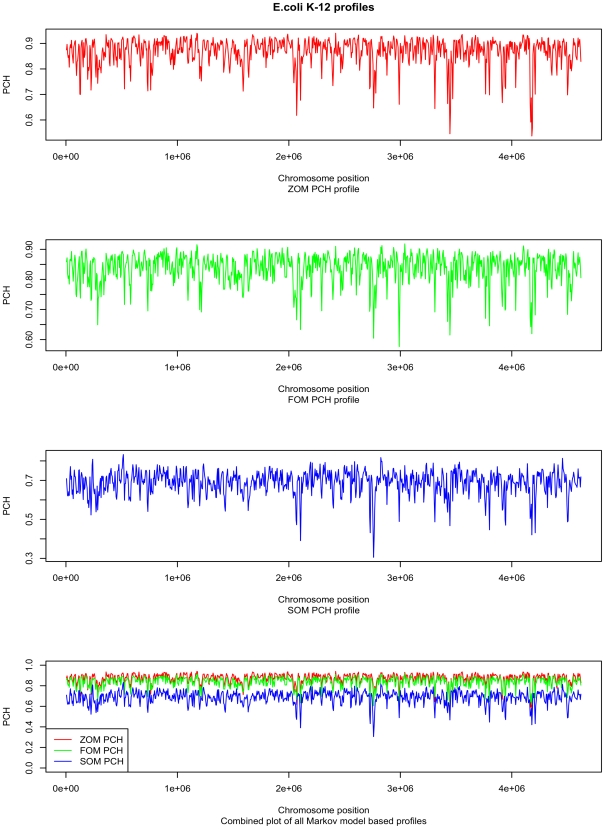
Background: DNA word frequencies, normalized for genomic AT content, are remarkably stable within prokaryotic genomes and are therefore said to reflect a "genomic signature." The genomic signatures can be used to phylogenetically classify organisms from arbitrary sampled DNA. Genomic signatures can also be used to search for horizontally transferred DNA or DNA regions subjected to special selection forces. Thus, the stability of the genomic signature can be used as a measure of genomic homogeneity. The factors associated with the stability of the genomic signatures are not known, and this motivated us to investigate further. We analyzed the intra-genomic variance of genomic signatures based on AT content normalization (0(th) order Markov model) as well as genomic signatures normalized by smaller DNA words (1(st) and 2(nd) order Markov models) for 636 sequenced prokaryotic genomes. Regression models were fitted, with intra-genomic signature variance as the response variable, to a set of factors representing genomic properties such as genomic AT content, genome size, habitat, phylum, oxygen requirement, optimal growth temperature and oligonucleotide usage variance (OUV, a measure of oligonucleotide usage bias), measured as the variance between genomic tetranucleotide frequencies and Markov chain approximated tetranucleotide frequencies, as predictors.
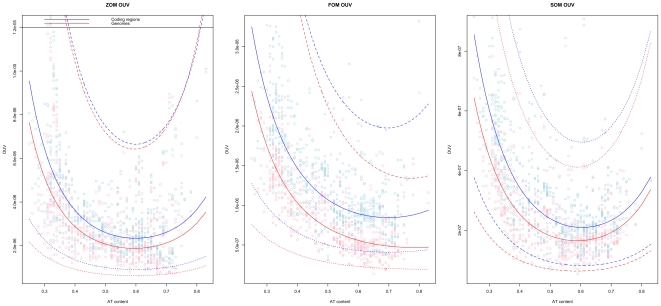
Principal findings: Regression analysis revealed that OUV was the most important factor (p<0.001) determining intra-genomic homogeneity as measured using genomic signatures. This means that the less random the oligonucleotide usage is in the sense of higher OUV, the more homogeneous the genome is in terms of the genomic signature. The other factors influencing variance in the genomic signature (p<0.001) were genomic AT content, phylum and oxygen requirement.
Conclusions: Genomic homogeneity in prokaryotes is intimately linked to genomic GC content, oligonucleotide usage bias (OUV) and aerobiosis, while oligonucleotide usage bias (OUV) is associated with genomic GC content, aerobiosis and habitat.
Conflict of interest statement
Figures
Similar articles
-
Reliability and applications of statistical methods based on oligonucleotide frequencies in bacterial and archaeal genomes.BMC Genomics. 2008 Feb 28;9:104. doi: 10.1186/1471-2164-9-104. BMC Genomics. 2008. PMID: 18307761 Free PMC article.
-
Analysis of intra-genomic GC content homogeneity within prokaryotes.BMC Genomics. 2010 Aug 6;11:464. doi: 10.1186/1471-2164-11-464. BMC Genomics. 2010. PMID: 20691090 Free PMC article.
-
Analysis of genomic signatures in prokaryotes using multinomial regression and hierarchical clustering.BMC Genomics. 2009 Oct 21;10:487. doi: 10.1186/1471-2164-10-487. BMC Genomics. 2009. PMID: 19845945 Free PMC article.
-
Genomic signatures in microbes -- properties and applications.ScientificWorldJournal. 2011 Mar 22;11:715-25. doi: 10.1100/tsw.2011.70. ScientificWorldJournal. 2011. PMID: 21442149 Free PMC article. Review.
-
On the correlation between genomic G+C content and optimal growth temperature in prokaryotes: data quality and confounding factors.Biochem Biophys Res Commun. 2006 Apr 14;342(3):681-4. doi: 10.1016/j.bbrc.2006.02.037. Epub 2006 Feb 20. Biochem Biophys Res Commun. 2006. PMID: 16499870 Review.
Cited by
-
Genomic Signature in Evolutionary Biology: A Review.Biology (Basel). 2023 Feb 16;12(2):322. doi: 10.3390/biology12020322. Biology (Basel). 2023. PMID: 36829597 Free PMC article. Review.
-
Stoichiogenomics: the evolutionary ecology of macromolecular elemental composition.Trends Ecol Evol. 2011 Jan;26(1):38-44. doi: 10.1016/j.tree.2010.10.006. Epub 2010 Nov 18. Trends Ecol Evol. 2011. PMID: 21093095 Free PMC article. Review.
-
Natural selection retains overrepresented out-of-frame stop codons against frameshift peptides in prokaryotes.BMC Genomics. 2010 Sep 9;11:491. doi: 10.1186/1471-2164-11-491. BMC Genomics. 2010. PMID: 20828396 Free PMC article.
-
Amino acid usage is asymmetrically biased in AT- and GC-rich microbial genomes.PLoS One. 2013 Jul 26;8(7):e69878. doi: 10.1371/journal.pone.0069878. Print 2013. PLoS One. 2013. PMID: 23922837 Free PMC article.
-
Across bacterial phyla, distantly-related genomes with similar genomic GC content have similar patterns of amino acid usage.PLoS One. 2011 Mar 10;6(3):e17677. doi: 10.1371/journal.pone.0017677. PLoS One. 2011. PMID: 21423704 Free PMC article.
References
-
- Ussery D, Soumpasis DM, Brunak S, Staerfeldt HH, Worning P, et al. Bias of purine stretches in sequenced chromosomes. Comput Chem. 2002;26(5):531–541. - PubMed
-
- Vaillant C, Audit B, Thermes C, Arneodo A. Formation and positioning of nucleosomes: Effect of sequence-dependent long-range correlated structural disorder. Eur Phys J E Soft Matter. 2006;19(3):263–277. - PubMed
-
- Garcia JA, Bartumeus F, Roche D, Giraldo J, Stanley HE, et al. Ecophysiological significance of scale-dependent patterns in prokaryotic genomes unveiled by a combination of statistic and genometric analyses. Genomics. 2008;91(6):538–543. - PubMed
-
- Ewens WJ, Grant GR. Statistical methods in bioinformatics. Springer 2001
Publication types
MeSH terms
Substances
LinkOut - more resources
Full Text Sources
Molecular Biology Databases
Miscellaneous
