. 2009 Dec 2;4(12):e8130.
doi: 10.1371/journal.pone.0008130.

Characterization of detergent-insoluble proteins in ALS indicates a causal link between nitrative stress and aggregation in pathogenesis

Affiliations

Characterization of detergent-insoluble proteins in ALS indicates a causal link between nitrative stress and aggregation in pathogenesis

Manuela Basso et al. PLoS One. .

Abstract

Background: Amyotrophic lateral sclerosis (ALS) is a progressive and fatal motor neuron disease, and protein aggregation has been proposed as a possible pathogenetic mechanism. However, the aggregate protein constituents are poorly characterized so knowledge on the role of aggregation in pathogenesis is limited.

Methodology/principal findings: We carried out a proteomic analysis of the protein composition of the insoluble fraction, as a model of protein aggregates, from familial ALS (fALS) mouse model at different disease stages. We identified several proteins enriched in the detergent-insoluble fraction already at a preclinical stage, including intermediate filaments, chaperones and mitochondrial proteins. Aconitase, HSC70 and cyclophilin A were also significantly enriched in the insoluble fraction of spinal cords of ALS patients. Moreover, we found that the majority of proteins in mice and HSP90 in patients were tyrosine-nitrated. We therefore investigated the role of nitrative stress in aggregate formation in fALS-like murine motor neuron-neuroblastoma (NSC-34) cell lines. By inhibiting nitric oxide synthesis the amount of insoluble proteins, particularly aconitase, HSC70, cyclophilin A and SOD1 can be substantially reduced.

Conclusion/significance: Analysis of the insoluble fractions from cellular/mouse models and human tissues revealed novel aggregation-prone proteins and suggests that nitrative stress contribute to protein aggregate formation in ALS.


Conflict of interest statement

Competing Interests: The authors have declared that no competing interests exist.

Figures

Figure 1
Figure 1. 2DE proteomic analysis.
Representative Sypro Ruby-stained 2DE maps of TIF of late-symptomatic G93A SOD1 mice (A) and age-matched WT SOD1 mice (B). In panel A the numbered spots correspond to proteins enriched or only present in TIF of G93A samples, and in panel B they indicate proteins enriched in TIF of WT samples. The same amount of protein was loaded in each gel (75 µg). The asterisk indicates the spot corresponding to GFAP, which is the most prominent, but equally abundant in the two conditions, and was therefore considered as background.
Figure 2
Figure 2. Immunoblot validation of TIF in mouse samples.
Representative immunoblot of TIF and corresponding soluble fraction from spinal cord of late-symptomatic G93A SOD1 mice and age-matched WT SOD1 mice. Same amounts of TIF and soluble proteins (30 µg) were loaded in each immunoblot and probed with the specific antibodies. Immunoreactivity was normalized to the actual amount of protein loaded as detected after Coomassie blue staining.
Figure 3
Figure 3. Immunoblot validation of TIF in human samples.
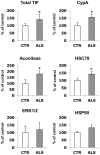
Dot blot analysis of TIF in spinal cord tissues of sporadic ALS patients (n = 7), black bars, and controls (CTR) (n = 3), white bars. Total TIF is the ratio of the amount of TIF to the total proteins extracted. Proteins were quantified by the BCA protein assay. The same amount of TIF (3 µg) was loaded on the membrane and probed with the specific antibodies. Histograms represent the immunoreactivity normalized to the actual amount of protein loaded, detected after Red Ponceau staining. Values are percentages of controls and are the mean±SD. *, significantly different from controls as assessed by unpaired t test with Welsh's correction (p<0.05).
Figure 4
Figure 4. Immunohistochemistry of aconitase.
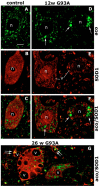
Immunolabelling for aconitase (A, C, D, F, G, green) and human SOD1 (B, C, E–G, red) in ventral horn lumbar spinal cord sections from a 26-week-old control WT SOD1 mouse (A–C) and G93A SOD1 mice at 12 (D–F) and 26 (G) weeks. C, F, G are merged images. In controls the human SOD1-expressing motor neurons show fine punctate aconitase labelling (A–C), whereas in presymptomatic G93A SOD1 mice the motor neurons expressing mutant human SOD1 show large aggregates of aconitase (D, arrows) only partially overlapping SOD1-positive aggregates (F). In end-stage G93A SOD1 mice (G) aggregates of aconitase and SOD1 are present in large vacuolated (v) motor neurons and also in the surrounding neuropil (double arrows); n, nuclei; v, vacuoles. Bar = 40 µm.
Figure 5
Figure 5. Ultrastructural localization of aconitase.
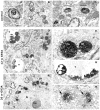
Immunolabelling in the ventral horn of non-trasgenic control mice at 26 weeks of age (A–C) and of G93A SOD1 mice at pre-symptomatic (12 weeks, D–E) and end-stage (26 weeks, F–G) of disease. In controls labelling is in mitochondria (m) located in axons (A), cell bodies (B) and dendrites (C). In G93A SOD1 mice intensely labelled mitochondria (m) are clustered together in dendrites (D) and cell bodies (F), swollen (E) and apposed at the membrane of vacuoles (v) (D, G). Occasional clumps of aconitase-positive material (arrows) are found in end-stage motor neurons (H). N, Nucleus; nu, nucleolus. Bars: A–C, E = 1 µm; D, F = 2,5 µm; G = 1,2 µm; H = 1,4 µm.
Figure 6
Figure 6. Analysis of nitrated proteins in TIF of 17-week-old G93A SOD1 mice.
150 µg of TIF was loaded into the 2D gel and transferred onto a PDVF membrane. The blot was probed with anti-nitrotyrosine polyclonal antibody (A), after total protein SYPRO Ruby blot staining (B). Nitrated protein signals of the 2D WB were matched and localized in a twin 2D gel and proteins were identified by peptide mass fingerprinting. Spot numbers in (A) correspond to proteins in Table 2. a, b and c are spots corresponding respectively to laminin subunit beta-2, VDAC, GFAP, that were not specifically increased in G93A TIF in the proteomic screening. (C) Dot blot analysis of nitrated HSP90 in TIF of spinal cord tissues of controls (CTR) (n = 3), white bars, and sporadic ALS patients (n = 7), grey bars. The same amount of TIF (3 µg) was loaded on the membrane and probed with the specific antibody. Histograms represent the immunoreactivity normalized to the actual amount of protein loaded, as detected after Red Ponceau staining. Values are percentages of controls and are the mean±SD. *, significantly different from controls as assessed by unpaired t test with Welsh's correction (p<0.05). Representative dot blots for a control and an ALS patient are reported.
Figure 7
Figure 7. Analysis of TIF of NSC-34 cells expressing WT and G93A hSOD1, treated or not with MG132, L-NAME or both.
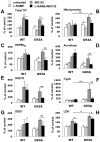
(A) Total TIF is the ratio of the amount of TIF to the total proteins extracted. Proteins were quantified in each condition by the BCA protein assay. Values are percentages of the untreated WT control and are the mean±SEM (n = 3). (B–G) The level of nitrotyrosine, nitrated HSP90 (HSP90NT), aconitase, HSC70, CypA and SOD1 were measured by dot blot analysis. The same amount of cellular TIF (3 µg) was loaded on the membrane and probed with the specific antibodies. Histograms represent the immunoreactivity normalized to the actual amount of protein loaded, as detected after Red Ponceau staining, multiplied by the total TIF isolated for each condition. Values are percentages of the untreated WT control and are the mean±SEM (n = 3). *, significantly different from untreated G93A controls (p<0.05); **, significantly different from MG132-treated G93A samples (p<0.05); ***, significantly different from MG132-treated WT samples (p<0.05), as assessed by one-way ANOVA followed by Newman-Keuls multiple comparison test. (H) Analysis of cell death by quantification of extracellular LDH activity. Histograms represent mean±SD of four replicates. One-way ANOVA was followed by Newman-Keuls multiple comparison test. *, p<0.05.

References

    1. Ross CA, Poirier MA. What is the role of protein aggregation in neurodegeneration? Nat Rev Mol Cell Biol. 2005;6:891–898. - PubMed
    1. Strong MJ, Kesavapany S, Pant HC. The pathobiology of amyotrophic lateral sclerosis: a proteinopathy? J Neuropathol Exp Neurol. 2005;64:649–664. - PubMed
    1. Bruijn LI, Houseweart MK, Kato S, Anderson KL, Anderson SD, et al. Aggregation and motor neuron toxicity of an ALS-linked SOD1 mutant independent from wild-type SOD1. Science. 1998;281:1851–1854. - PubMed
    1. Durham HD, Roy J, Dong L, Figlewicz DA. Aggregation of mutant Cu/Zn superoxide dismutase proteins in a culture model of ALS. J Neuropathol Exp Neurol. 1997;56:523–530. - PubMed
    1. Basso M, Massignan T, Samengo G, Cheroni C, De Biasi S, et al. Insoluble mutant SOD1 is partly oligoubiquitinated in amyotrophic lateral sclerosis mice. J Biol Chem. 2006;281:33325–33335. - PubMed

Publication types

MeSH terms