

A dynamic analysis of IRS-PKR signaling in liver cells: a discrete modeling approach
- PMID: 19956598
- PMCID: PMC2779448
- DOI: 10.1371/journal.pone.0008040
A dynamic analysis of IRS-PKR signaling in liver cells: a discrete modeling approach
Abstract
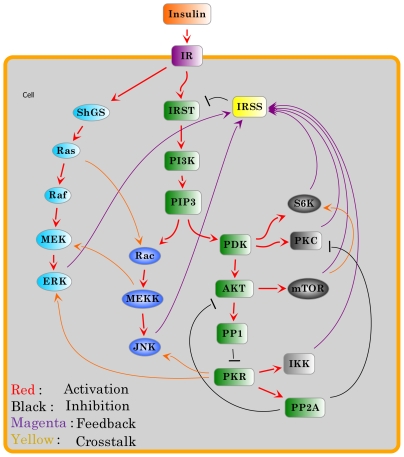
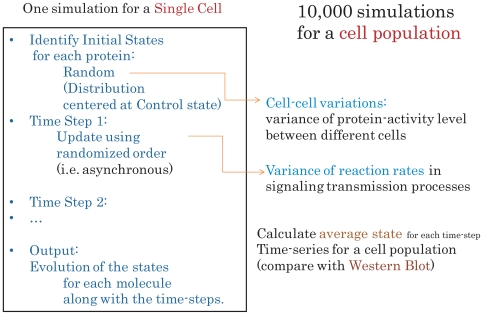
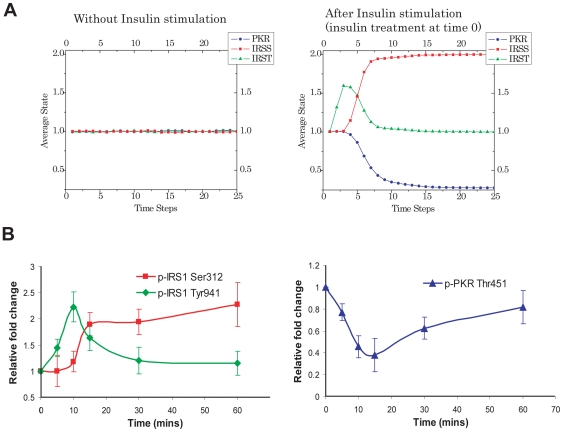
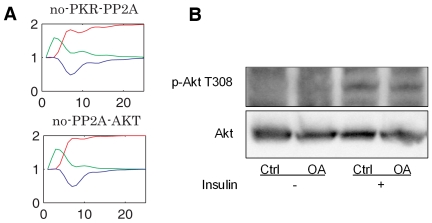
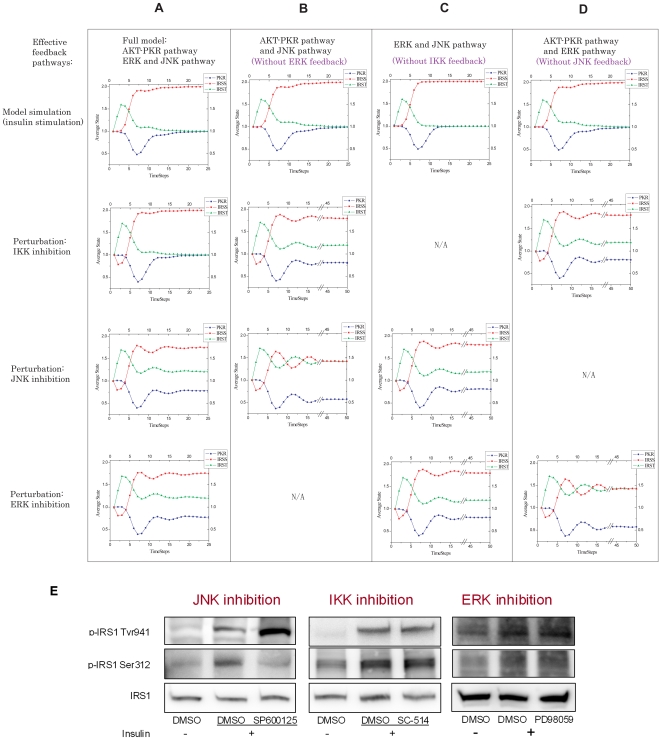
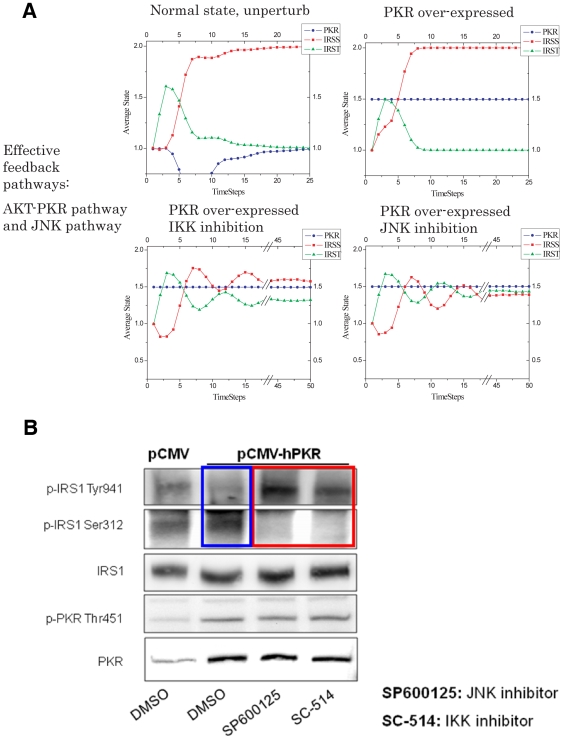
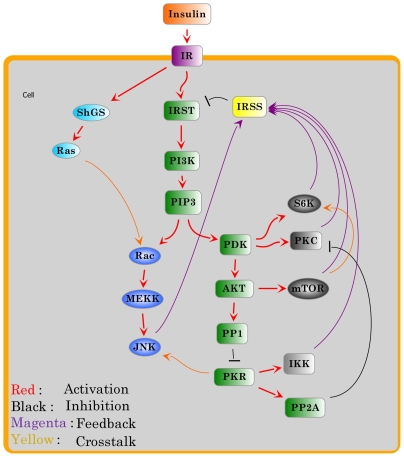
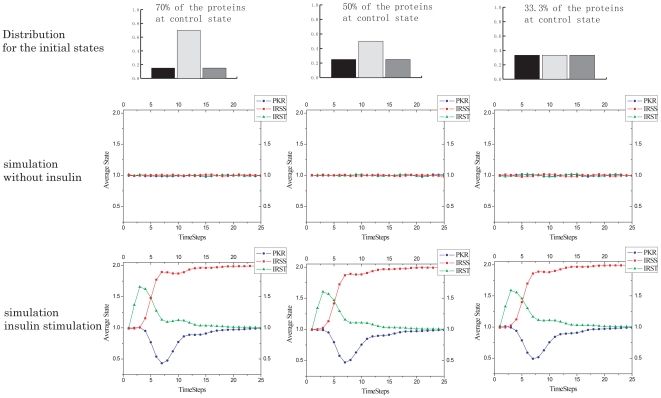
A major challenge in systems biology is to develop a detailed dynamic understanding of the functions and behaviors in a particular cellular system, which depends on the elements and their inter-relationships in a specific network. Computational modeling plays an integral part in the study of network dynamics and uncovering the underlying mechanisms. Here we proposed a systematic approach that incorporates discrete dynamic modeling and experimental data to reconstruct a phenotype-specific network of cell signaling. A dynamic analysis of the insulin signaling system in liver cells provides a proof-of-concept application of the proposed methodology. Our group recently identified that double-stranded RNA-dependent protein kinase (PKR) plays an important role in the insulin signaling network. The dynamic behavior of the insulin signaling network is tuned by a variety of feedback pathways, many of which have the potential to cross talk with PKR. Given the complexity of insulin signaling, it is inefficient to experimentally test all possible interactions in the network to determine which pathways are functioning in our cell system. Our discrete dynamic model provides an in silico model framework that integrates potential interactions and assesses the contributions of the various interactions on the dynamic behavior of the signaling network. Simulations with the model generated testable hypothesis on the response of the network upon perturbation, which were experimentally evaluated to identify the pathways that function in our particular liver cell system. The modeling in combination with the experimental results enhanced our understanding of the insulin signaling dynamics and aided in generating a context-specific signaling network.
Conflict of interest statement
Figures
Similar articles
-
Double-stranded RNA-activated protein kinase is a key modulator of insulin sensitivity in physiological conditions and in obesity in mice.Endocrinology. 2012 Nov;153(11):5261-74. doi: 10.1210/en.2012-1400. Epub 2012 Sep 4. Endocrinology. 2012. PMID: 22948222
-
Dynamic Modeling and Analysis of the Cross-Talk between Insulin/AKT and MAPK/ERK Signaling Pathways.PLoS One. 2016 Mar 1;11(3):e0149684. doi: 10.1371/journal.pone.0149684. eCollection 2016. PLoS One. 2016. PMID: 26930065 Free PMC article.
-
The double-stranded RNA-dependent protein kinase differentially regulates insulin receptor substrates 1 and 2 in HepG2 cells.Mol Biol Cell. 2010 Oct 1;21(19):3449-58. doi: 10.1091/mbc.E10-06-0481. Epub 2010 Aug 4. Mol Biol Cell. 2010. PMID: 20685959 Free PMC article.
-
Computational modeling of mammalian signaling networks.Wiley Interdiscip Rev Syst Biol Med. 2010 Mar-Apr;2(2):194-209. doi: 10.1002/wsbm.52. Wiley Interdiscip Rev Syst Biol Med. 2010. PMID: 20836022 Free PMC article. Review.
-
Computational analysis of signaling patterns in single cells.Semin Cell Dev Biol. 2015 Jan;37:35-43. doi: 10.1016/j.semcdb.2014.09.015. Epub 2014 Sep 26. Semin Cell Dev Biol. 2015. PMID: 25263011 Free PMC article. Review.
Cited by
-
Logic-based models for the analysis of cell signaling networks.Biochemistry. 2010 Apr 20;49(15):3216-24. doi: 10.1021/bi902202q. Biochemistry. 2010. PMID: 20225868 Free PMC article. Review.
-
An integrative modeling framework reveals plasticity of TGF-β signaling.BMC Syst Biol. 2014 Mar 12;8:30. doi: 10.1186/1752-0509-8-30. BMC Syst Biol. 2014. PMID: 24618419 Free PMC article.
-
Logic-based models in systems biology: a predictive and parameter-free network analysis method.Integr Biol (Camb). 2012 Nov;4(11):1323-37. doi: 10.1039/c2ib20193c. Integr Biol (Camb). 2012. PMID: 23072820 Free PMC article. Review.
-
Incorporation of Oxidized Phenylalanine Derivatives into Insulin Signaling Relevant Proteins May Link Oxidative Stress to Signaling Conditions Underlying Chronic Insulin Resistance.Biomedicines. 2022 Apr 22;10(5):975. doi: 10.3390/biomedicines10050975. Biomedicines. 2022. PMID: 35625712 Free PMC article.
-
Toward a systems-level view of dynamic phosphorylation networks.Front Genet. 2014 Aug 15;5:263. doi: 10.3389/fgene.2014.00263. eCollection 2014. Front Genet. 2014. PMID: 25177341 Free PMC article. Review.
References
-
- Lazebnik Y. Can a biologist fix a radio?–Or, what I learned while studying apoptosis. Cancer Cell. 2002;2:179–182. - PubMed
-
- Tyson JJ, Chen KC, Novak B. Sniffers, buzzers, toggles and blinkers: dynamics of regulatory and signaling pathways in the cell. Current Opinion in Cell Biology. 2003;15:221–231. - PubMed
-
- Yang X, Opperman M, Chan C. A downstream target of insulin signaling, PKR, differentially regulates IRS1 under review. 2009
-
- de Jong H. Modeling and simulation of genetic regulatory systems: a literature review. Journal of Computational Biology: A Journal of Computational Molecular Cell Biology. 2002;9:67–103. - PubMed
-
- Hasty J, McMillen D, Isaacs F, Collins JJ. Computational studies of gene regulatory networks: in numero molecular biology. Nature Reviews Genetics. 2001;2:268–279. - PubMed
Publication types
MeSH terms
Substances
Grants and funding
LinkOut - more resources
Full Text Sources
