

Frequent long-range epigenetic silencing of protocadherin gene clusters on chromosome 5q31 in Wilms' tumor
- PMID: 19956686
- PMCID: PMC2776977
- DOI: 10.1371/journal.pgen.1000745
Frequent long-range epigenetic silencing of protocadherin gene clusters on chromosome 5q31 in Wilms' tumor
Erratum in
- PLoS Genet. 2009 Dec;5(12). doi: 10.1371/annotation/012d5a44-8239-4057-8c3b-3dc159ea3a02
Abstract
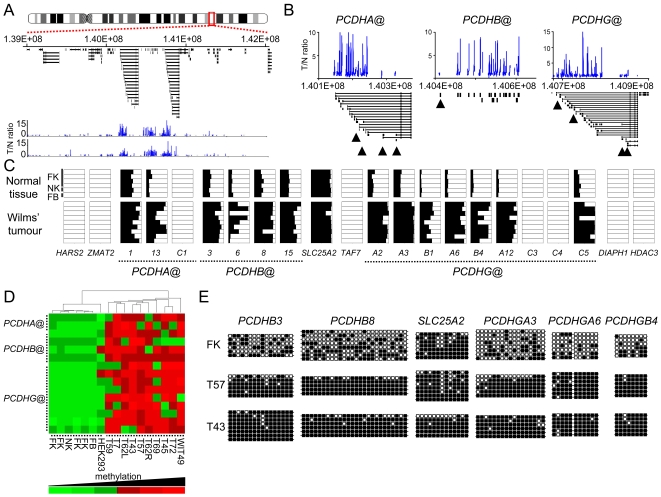
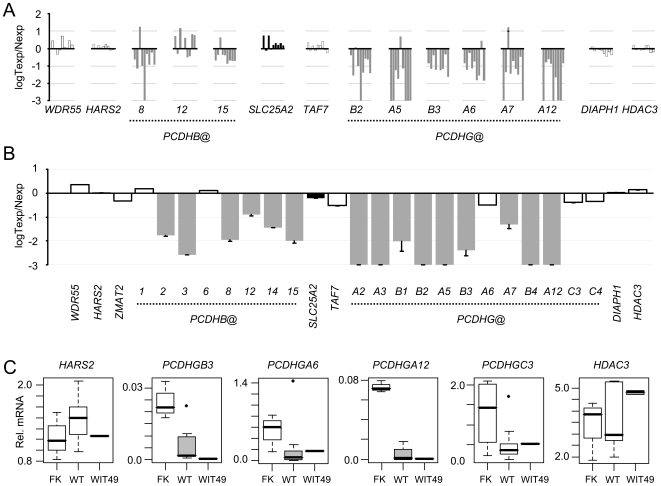
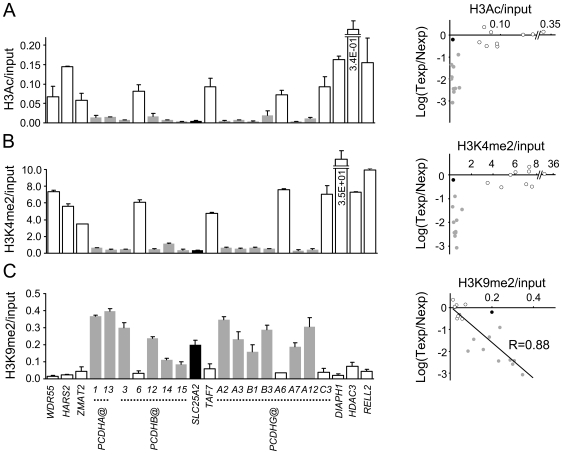
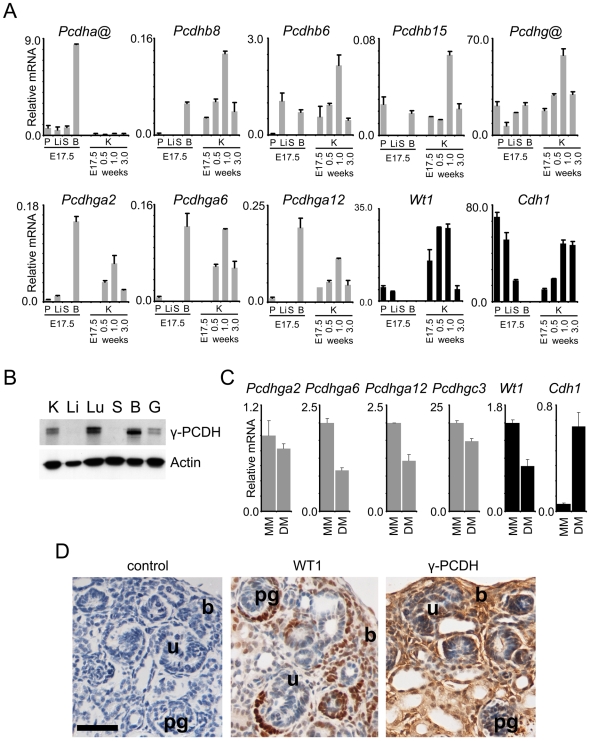
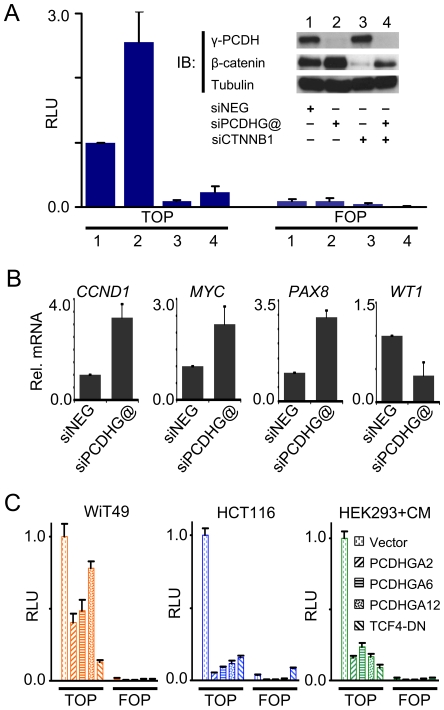
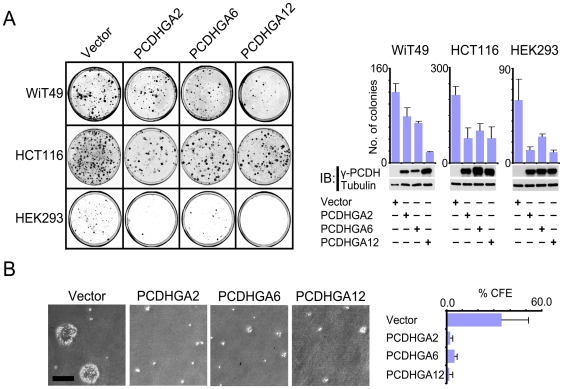
Wilms' tumour (WT) is a pediatric tumor of the kidney that arises via failure of the fetal developmental program. The absence of identifiable mutations in the majority of WTs suggests the frequent involvement of epigenetic aberrations in WT. We therefore conducted a genome-wide analysis of promoter hypermethylation in WTs and identified hypermethylation at chromosome 5q31 spanning 800 kilobases (kb) and more than 50 genes. The methylated genes all belong to alpha-, beta-, and gamma-protocadherin (PCDH) gene clusters (Human Genome Organization nomenclature PCDHA@, PCDHB@, and PCDHG@, respectively). This demonstrates that long-range epigenetic silencing (LRES) occurs in developmental tumors as well as in adult tumors. Bisulfite polymerase chain reaction analysis showed that PCDH hypermethylation is a frequent event found in all Wilms' tumor subtypes. Hypermethylation is concordant with reduced PCDH expression in tumors. WT precursor lesions showed no PCDH hypermethylation, suggesting that de novo PCDH hypermethylation occurs during malignant progression. Discrete boundaries of the PCDH domain are delimited by abrupt changes in histone modifications; unmethylated genes flanking the LRES are associated with permissive marks which are absent from methylated genes within the domain. Silenced genes are marked with non-permissive histone 3 lysine 9 dimethylation. Expression analysis of embryonic murine kidney and differentiating rat metanephric mesenchymal cells demonstrates that Pcdh expression is developmentally regulated and that Pcdhg@ genes are expressed in blastemal cells. Importantly, we show that PCDHs negatively regulate canonical Wnt signalling, as short-interfering RNA-induced reduction of PCDHG@ encoded proteins leads to elevated beta-catenin protein, increased beta-catenin/T-cell factor (TCF) reporter activity, and induction of Wnt target genes. Conversely, over-expression of PCDHs suppresses beta-catenin/TCF-reporter activity and also inhibits colony formation and growth of cancer cells in soft agar. Thus PCDHs are candidate tumor suppressors that modulate regulatory pathways critical in development and disease, such as canonical Wnt signaling.
Conflict of interest statement
The authors have declared that no competing interests exist.
Figures
Similar articles
-
Long-range epigenetic silencing of chromosome 5q31 protocadherins is involved in early and late stages of colorectal tumorigenesis through modulation of oncogenic pathways.Oncogene. 2012 Oct 4;31(40):4409-19. doi: 10.1038/onc.2011.609. Epub 2012 Jan 16. Oncogene. 2012. PMID: 22249255 Free PMC article.
-
Combinatorial Effects of Alpha- and Gamma-Protocadherins on Neuronal Survival and Dendritic Self-Avoidance.J Neurosci. 2018 Mar 14;38(11):2713-2729. doi: 10.1523/JNEUROSCI.3035-17.2018. Epub 2018 Feb 8. J Neurosci. 2018. PMID: 29439167 Free PMC article.
-
Clustered protocadherins methylation alterations in cancer.Clin Epigenetics. 2019 Jul 9;11(1):100. doi: 10.1186/s13148-019-0695-0. Clin Epigenetics. 2019. PMID: 31288858 Free PMC article.
-
Regulation of clustered protocadherin genes in individual neurons.Semin Cell Dev Biol. 2017 Sep;69:122-130. doi: 10.1016/j.semcdb.2017.05.026. Epub 2017 Jun 4. Semin Cell Dev Biol. 2017. PMID: 28591566 Review.
-
Non-clustered protocadherin.Cell Adh Migr. 2011 Mar-Apr;5(2):97-105. doi: 10.4161/cam.5.2.14374. Epub 2011 Mar 1. Cell Adh Migr. 2011. PMID: 21173574 Free PMC article. Review.
Cited by
-
Clinical potentials of methylator phenotype in stage 4 high-risk neuroblastoma: an open challenge.PLoS One. 2013 May 22;8(5):e63253. doi: 10.1371/journal.pone.0063253. Print 2013. PLoS One. 2013. PMID: 23717404 Free PMC article.
-
Single-neuron diversity generated by Protocadherin-β cluster in mouse central and peripheral nervous systems.Front Mol Neurosci. 2012 Aug 31;5:90. doi: 10.3389/fnmol.2012.00090. eCollection 2012. Front Mol Neurosci. 2012. PMID: 22969705 Free PMC article.
-
ZO-1 and ZONAB interact to regulate proximal tubular cell differentiation.J Am Soc Nephrol. 2010 Mar;21(3):388-90. doi: 10.1681/ASN.2010010061. Epub 2010 Feb 4. J Am Soc Nephrol. 2010. PMID: 20133486 Free PMC article. No abstract available.
-
Loss of WSTF results in spontaneous fluctuations of heterochromatin formation and resolution, combined with substantial changes to gene expression.BMC Genomics. 2013 Oct 29;14:740. doi: 10.1186/1471-2164-14-740. BMC Genomics. 2013. PMID: 24168170 Free PMC article.
-
CRYβB2 alters cell adhesion to promote invasion in a triple-negative breast cancer cell line.BMC Res Notes. 2025 Jan 21;18(1):26. doi: 10.1186/s13104-025-07090-w. BMC Res Notes. 2025. PMID: 39838415 Free PMC article.
References
-
- Rivera MN, Haber DA. Wilms' tumour: connecting tumorigenesis and organ development in the kidney. Nat Rev Cancer. 2005;5:699–712. - PubMed
-
- Dallosso AR, Hancock AL, Brown KW, Williams AC, Jackson S, et al. Genomic Imprinting at the WT1 gene involves a novel coding transcript (AWT1) that shows deregulation in Wilms' tumours. Hum Mol Genet. 2003;13:405–415. - PubMed
-
- Malik K, Salpekar A, Hancock A, Moorwood K, Jackson S, et al. Identification of differential methylation of the WT1 antisense regulatory region and relaxation of imprinting in Wilms' tumor. Cancer Res. 2000;60:2356–2360. - PubMed
-
- Ogawa O, Eccles MR, Szeto J, McNoe LA, Yun K, et al. Relaxation of Insulin-Like Growth Factor-II Gene Imprinting Implicated in Wilms' Tumour. Nature. 1993;362:749–751. - PubMed
-
- Brown KW, Power F, Moore B, Charles AK, Malik KT. Frequency and timing of loss of imprinting at 11p13 and 11p15 in Wilms' tumor development. Mol Cancer Res. 2008;6:1114–1123. - PubMed
Publication types
MeSH terms
Substances
Grants and funding
LinkOut - more resources
Full Text Sources
Other Literature Sources
Medical
Molecular Biology Databases
Miscellaneous
