. 2009 Nov 24;4(11):e8015.
doi: 10.1371/journal.pone.0008015.

Multiplicative auditory spatial receptive fields created by a hierarchy of population codes

Affiliations

Multiplicative auditory spatial receptive fields created by a hierarchy of population codes

Brian J Fischer et al. PLoS One. .

Abstract

A multiplicative combination of tuning to interaural time difference (ITD) and interaural level difference (ILD) contributes to the generation of spatially selective auditory neurons in the owl's midbrain. Previous analyses of multiplicative responses in the owl have not taken into consideration the frequency-dependence of ITD and ILD cues that occur under natural listening conditions. Here, we present a model for the responses of ITD- and ILD-sensitive neurons in the barn owl's inferior colliculus which satisfies constraints raised by experimental data on frequency convergence, multiplicative interaction of ITD and ILD, and response properties of afferent neurons. We propose that multiplication between ITD- and ILD-dependent signals occurs only within frequency channels and that frequency integration occurs using a linear-threshold mechanism. The model reproduces the experimentally observed nonlinear responses to ITD and ILD in the inferior colliculus, with greater accuracy than previous models. We show that linear-threshold frequency integration allows the system to represent multiple sound sources with natural sound localization cues, whereas multiplicative frequency integration does not. Nonlinear responses in the owl's inferior colliculus can thus be generated using a combination of cellular and network mechanisms, showing that multiple elements of previous theories can be combined in a single system.


Conflict of interest statement

Competing Interests: The authors have declared that no competing interests exist.

Figures

Figure 1
Figure 1. Input-Output response of an ICx neuron.
The mapping from the average membrane potential of an ICx neuron over the presentation of a sound stimulus to the number of spikes produced is fit with a power function (dotted line) and a threshold-sigmoid function (solid line). The threshold-sigmoid function is used as the input-output nonlinearity for model ICcl and ICx neurons.
Figure 2
Figure 2. Block diagram of model.
The initial components of the model extract time-dependent localization cues using a running cross-correlation, denoted x, and the interaural level difference, denoted z, from auditory input signals. A network model of spiking neurons uses these cues, along with a measure of stimulus intensity given by an energy envelope (y), as input to neurons in the lateral shell of the central nucleus of the inferior colliculus (ICcl), which converge on the external nucleus of the inferior colliculus (ICx). ICcl neurons add a function of the running cross-correlation with another function of the interaural level difference and energy envelope and pass the result through a spiking nonlinearity to produce the probability of spiking. The two central assumptions of the ICx model are, first, that frequency integration at the subthreshold level is linear and, second, that multiplication between ITD- and ILD-dependent signals occurs only within frequency channels. Connection weights between ICcl neurons and the target ICx neuron are selected to enforce these assumptions.
Figure 3
Figure 3. Accuracy of the multiplicative model as a function of spiking threshold in ICcl.
The relative accuracy of the additive and multiplicative models of ITD-ILD interaction, summarized by the correlation between the multiplicative fit and the response (A) and the multiplication index (B), depends systematically on the difference between the threshold value of the input-output curve and the center of the dynamic range of the neuron's membrane potential response to ITD and ILD, denoted as Δthreshold. Δthreshold is illustrated for positive (C) and negative (D) values. (E,G,I) ITD-ILD response matrices of model ICcl neurons with different thresholds. (F,H,J) Experimentally measured ITD-ILD response matrices .
Figure 4
Figure 4. Spiking responses of ICcl neurons are not purely multiplicative.
ITD curves obtained at different ILD values were not purely gain-modulated versions of each other in both the experimentally measured responses (A) and the model responses (B). (C,D) Normalized versions of the ITD curves shown in (A,B).
Figure 5
Figure 5. ICcl spiking responses are more multiplicative than are subthreshold responses.
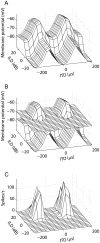
The subthreshold response of a model ICcl neuron (A) reflects the additive interaction of ITD and ILD specified in the model form. The spiking threshold (B) limits responses to discrete regions of ITD and ILD, which produces a spiking response that is well described by a multiplicative model (C).
Figure 6
Figure 6. Reproduction of subthreshold responses to ITD and ILD in ICx.
The model assumes that ICx subthreshold responses consist of a sum across frequency of products of ITD- and ILD-dependent components. (A–E) Example frequency components for an ICx neuron. (F) Comparison of the relative mean-square-error of the nonlinear-linear model to the relative mean-square-error of the SVD model of responses of 14 ICx neurons. The error is shown for the static and spiking versions of the nonlinear-linear model. The relative error is the mean-square error divided by the dynamic range of the neuron's response. The static (H) and spiking (G) models were able to reproduce the subthreshold responses of ICx neurons to ITD and ILD (I) .
Figure 7
Figure 7. The accuracy of the multiplicative model decreases for ICx neurons with receptive field away from the center of gaze.
(A) The ITD and ILD spectra at direction (0°,0°) are approximately constant across frequency . A model neuron with additive frequency integration and best direction (0°,0°) has a response to ITD and ILD that is well described by multiplication (B). (C) The ITD and ILD spectra at directions away from the center of gaze can vary significantly with frequency. (D) A model neuron with additive frequency integration and best direction (30°,−25°) has a response to ITD and ILD that is not as well described by multiplication as the neuron in (B).
Figure 8
Figure 8. Nonlinear frequency integration in ICx spiking responses.
Spiking (A) and subthreshold membrane potential (B) responses to single tones (F1 and F2) and sums of the individual tones (F1 + F2) in a model ICx neuron. (C,D) Approximation of the response to the sum of tones by an optimal linear combination of the responses to the individual tones. (E,F) Comparison of the optimal linear estimate with the response. The solid line is the identity line.
Figure 9
Figure 9. Model ICx responses are more multiplicative for tones than for two tones.
(A) Subthreshold ITD-ILD response matrix for a model ICx neuron obtained using a tonal stimulus. Since the model assumes that the response at each frequency is a product of an ITD-dependent function and an ILD-dependent function, the tonal response matrix is accurately described by multiplication. (B) In contrast, the response of the same model neuron obtained when ITD varies in one frequency and ILD varies in a second frequency is not accurately described by multiplication because the model assumes that frequency integration is linear.
Figure 10
Figure 10. Comparison of the population representation of multiple sound sources for models with additive and multiplicative frequency integration.
(A,B) The population response to two simultaneous spectrally distinct sources (solid line) located at −20 deg and 20 deg under the assumption of additive (A) and multiplicative (B) frequency integration. The dotted lines show the responses to the sounds presented alone. (C,D) The population response to two simultaneous spectrally distinct sources when one source is five times more intense than the other. In each plot, the responses are normalized by subtracting away the minimum value and then dividing by the maximum value.
Figure 11
Figure 11. ITD curves at different average binaural levels.
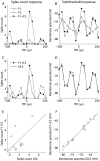
ITD curves at different average binaural levels given in spikes/stimulus (top row) and normalized units (bottom row) for two experimentally measured ICcl neurons.

Similar articles

Cited by

References

    1. Knudsen EI, Blasdel GG, Konishi M. Sound localization by the barn owl (Tyto alba) measured with the search coil technique. J Comp Phys A. 1979;133:1–11.
    1. Wagner H. Sound-localization deficits induced by lesions in the barn owl's auditory space map. J Neurosci. 1993;13:317–386. - PMC - PubMed
    1. Knudsen EI, Knudsen PF, Masino T. Parallel pathways mediating both sound localization and gaze control in the forebrain and midbrain of the barn owl. J Neurosci. 1993;13:2837–2852. - PMC - PubMed
    1. Knudsen EI, Du Lac S, Esterly SD. Computational maps in the brain. Annu Rev Neurosci. 1987;10:41–65. - PubMed
    1. Konishi M. Coding of auditory space. Annu Rev Neurosci. 2003;26:31–55. - PubMed

Publication types