. 2009 Nov 24;4(11):e7991.
doi: 10.1371/journal.pone.0007991.

BK channels control cerebellar Purkinje and Golgi cell rhythmicity in vivo

Affiliations

BK channels control cerebellar Purkinje and Golgi cell rhythmicity in vivo

Guy Cheron et al. PLoS One. .

Abstract

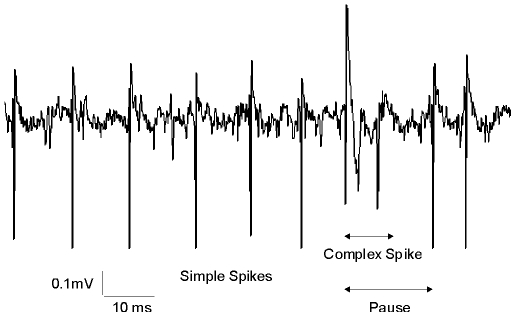
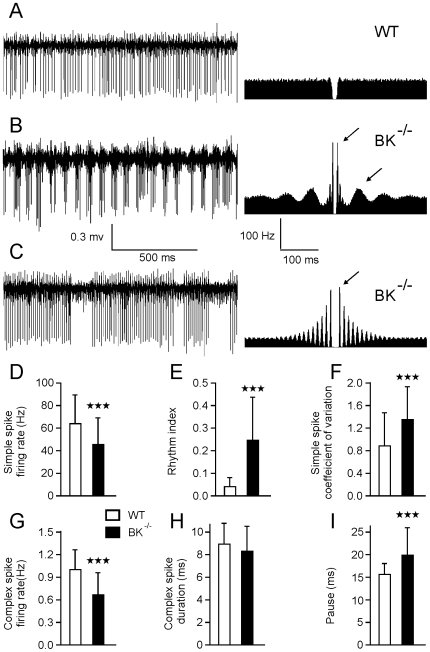
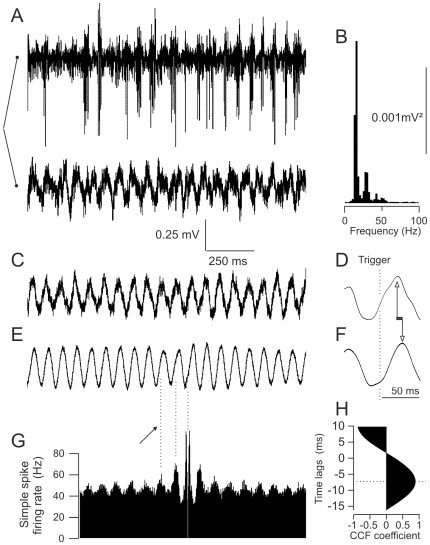
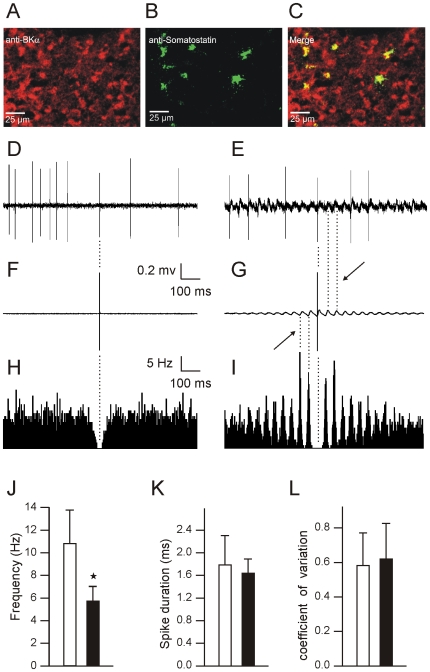
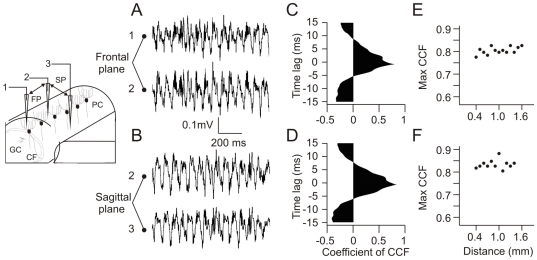
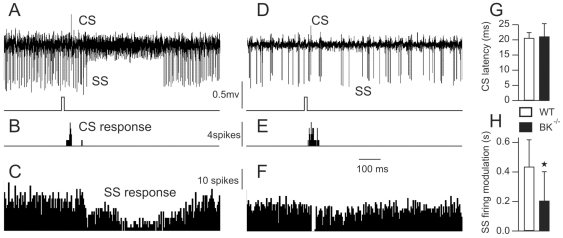
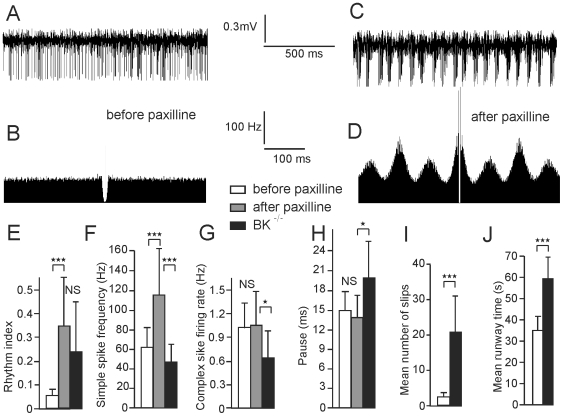
Calcium signaling plays a central role in normal CNS functioning and dysfunction. As cerebellar Purkinje cells express the major regulatory elements of calcium control and represent the sole integrative output of the cerebellar cortex, changes in neural activity- and calcium-mediated membrane properties of these cells are expected to provide important insights into both intrinsic and network physiology of the cerebellum. We studied the electrophysiological behavior of Purkinje cells in genetically engineered alert mice that do not express BK calcium-activated potassium channels and in wild-type mice with pharmacological BK inactivation. We confirmed BK expression in Purkinje cells and also demonstrated it in Golgi cells. We demonstrated that either genetic or pharmacological BK inactivation leads to ataxia and to the emergence of a beta oscillatory field potential in the cerebellar cortex. This oscillation is correlated with enhanced rhythmicity and synchronicity of both Purkinje and Golgi cells. We hypothesize that the temporal coding modification of the spike firing of both Purkinje and Golgi cells leads to the pharmacologically or genetically induced ataxia.


Conflict of interest statement

Competing Interests: The authors have declared that no competing interests exist.

Figures

Figure 1
Figure 1. Extracellular recording of a Purkinje cell in an alert mouse.
Note the two types of spikes, and the pause induced by the complex spike in the simple spike train.
Figure 2
Figure 2. Purkinje cells in BK−/− mice reveal different modes of simple spike firing.
(A) Representative extracellular recording of a Purkinje cell in a WT (A) and a BK−/− (B–C) mouse with corresponding autocorrelograms computed on a 120-s sample. Arrows indicate peaks that demonstrate rapid (C) and double rhythmicity (B). Central peak artifacts in the autocorrelograms were deleted, as in the following figures. (D–I) Bar graphs of simple spike firing rate (D), rhythm index (E), CV (F), and of complex spike firing rate (G), duration (H), and pause (I) in WT (n = 35) and in BK−/− (n = 48) Purkinje cells. Bars indicate standard deviation. (In this figure and in the following ones, * = p<0.05, , *** = p<0.0001).
Figure 3
Figure 3. Cerebellar cortices of BK−/− mice present a LFPO in the beta-range phase-locked with both the simple and complex spikes.
(A–B) Simultaneous recording of a LFPO and a Purkinje cell (250 µm-apart along the parallel fiber axis) and Fast-Fourier-Transform of the LFPO. (C–F). Spike-trigger averaging of the LFPO using the complex (C–D) and the simple (E–F) spike. Note the phase-difference in the phase-locking of complex and simple spikes. The smoother aspect of the simple spike triggered wave is due to the much greater number of triggering spikes. Traces D and F are low-pass filtered (<500 Hz); note the difference in time scale. Arrows indicate the time lag. (G) Simple spike autocorrelogram of the Purkinje cell illustrated in A. Arrow indicates the correspondence between low frequency rhythmicity and LFPO wave. (H) Cross-correlation function between the non-filtered simple and complex spike triggered averaging, confirming the time lag around 7 ms.
Figure 4
Figure 4. Golgi cells in BK−/− mice exhibit rhythmic firing phase-locked with the LFPO.
(A–C) Representative confocal laser scan microscopy images of mouse cerebellar cortex granular layer containing numerous and tiny granule cells, a bit larger unipolar brush cells and the much larger Golgi cells. The immunofluorescence of the granular layer shows BK channel expression (A; red) in tiny granule cells and in larger neurons as well as somatostatin expression, a marker for Golgi cells, in a fraction of large neurons (B; green). The colocalization (yellow) demonstrates BK channel-positive Golgi cells (C); scale bars: 25 µm. (D–I). Extracellular recording of a Golgi cell in a WT (D) and a BK−/− mouse (E) with spike triggered averaging (F–G) and autocorrelograms (H–I) of the corresponding recordings. Note the phase-locking and the rhythmicity of Golgi cells in BK−/− mice. (J–K) Bar graphs of Golgi spike frequency (J), duration (K), and CV (L) in WT (n = 5) and in BK−/− mice (n = 5).
Figure 5
Figure 5. LFPO in BK−/− mice is highly synchronized along the frontal and sagittal plane.
(A–B) Simultaneous recordings of two LFPO with electrodes at a distance of 400 µm apart along the frontal (A) and sagittal (B) planes. (C–D) Cross-correlation function (CCF) of the recorded signals illustrated in A and B. (E–F) Plotted values of the maximal CCF coefficient and the corresponding distance between recording electrodes in a same BK−/− mouse in the frontal (E) and in the sagittal (F) plane. Note the absence of significant variation.
Figure 6
Figure 6. Simple spike response of Purkinje cells to tactile stimulation is altered in BK−/− mice.
(A) Purkinje cells recorded in the Crus2A of a WT mouse during the stimulation of the whisker region, timing of stimulation is illustrated in the lower trace (CS = complex spike, SS = simple spike). (B,C) Bar graphs of complex (B) and simple (C) spike firing, 15 trials summed. (D) Purkinje cells recorded in the Crus2A of a BK−/− mouse during the stimulation of the whisker region. (E,F) Bar graph of complex (E) and simple (F) spike firing, 26 trials summed. (G) Bar graph of timing between stimulus and complex spike firing in WT and BK−/− mice. (H) Bar graph of simple spike response duration in WT and BK−/− mice.
Figure 7
Figure 7. Intracerebellar microinjection of paxilline in WT mice reproduces the rhythmic firing of Purkinje cells and the ataxic behavior of BK−/− mice.
(A,B) Spontaneous firing of a Purkinje cell recorded in a WT mouse (A) and corresponding autocorrelogram (B). Note the absence of rhythmicity. (C,D) The same, following microinjection of paxilline. (E–H) Bar graphs of Purkinje cells simple spike rhythmicity (n = 13)(E) and frequency (n = 13)(F), Purkinje cells complex spike frequency (n = 8)(G) and subsequent pause duration (n = 8) (H) before and after paxilline injection and in BK−/− (n = 48, value illustrated in fig 2 and reproduced here for comparison purpose). Stars indicate significance as in fig 2, for student t test for paired values (comparison between before and after injection) and unpaired values (comparison between WT PC after injection and PC in BK−/−) (I,J) Runway test, bar graph of mean number of slips (I) and time to reach the end of the bar (J) before and after paxilline injection (n = 9).

Similar articles

Cited by

References

    1. Raman IM, Bean BP. Resurgent sodium current and action potential formation in dissociated cerebellar Purkinje neurons. J Neurosci. 1997;17:4517–4526. - PMC - PubMed
    1. Edgerton JR, Reinhart PH. Distinct contributions of small and large conductance Ca2+-activated K+ channels to rat Purkinje neuron function. J Physiol (London) 2003;548:53–69. - PMC - PubMed
    1. Womack MD, Khodakhah K. Dendritic control of spontaneous bursting in cerebellar Purkinje cells. J Neurosci. 2004;24:3511–3521. - PMC - PubMed
    1. Marty A. Ca-dependent K channels with large unitary conductance in chromaffin cell membranes. Nature. 1981;291:497–500. - PubMed
    1. Latorre R, Brauchi S. Large conductance Ca2+-activated K+ (BK) channel: activation by Ca2+ and voltage. Biol Res. 2006;39:385–401. - PubMed

Publication types

Substances