

A conserved CXXC motif in CD3epsilon is critical for T cell development and TCR signaling
- PMID: 19956738
- PMCID: PMC2776832
- DOI: 10.1371/journal.pbio.1000253
A conserved CXXC motif in CD3epsilon is critical for T cell development and TCR signaling
Abstract
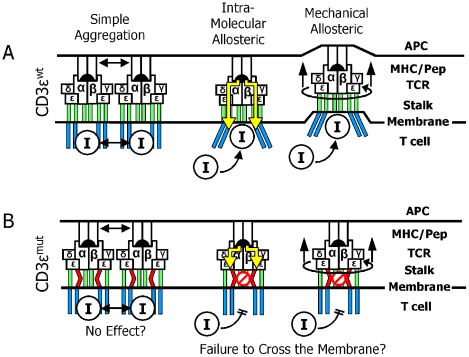
Virtually all T cell development and functions depend on its antigen receptor. The T cell receptor (TCR) is a multi-protein complex, comprised of a ligand binding module and a signal transmission module. The signal transmission module includes proteins from CD3 family (CD3epsilon, CD3delta, CD3gamma) as well as the zeta chain protein. The CD3 proteins have a short extracellular stalk connecting their Ig-like domains to their transmembrane regions. These stalks contain a highly evolutionarily conserved CXXC motif, whose function is unknown. To understand the function of these two conserved cysteines, we generated mice that lacked endogenous CD3epsilon but expressed a transgenic CD3epsilon molecule in which these cysteines were mutated to serines. Our results show that the mutated CD3epsilon could incorporate into the TCR complex and rescue surface TCR expression in CD3epsilon null mice. In the CD3epsilon mutant mice, all stages of T cell development and activation that are TCR-dependent were impaired, but not eliminated, including activation of mature naïve T cells with the MHCII presented superantigen, staphylococcal enterotoxin B, or with a strong TCR cross-linking antibody specific for either TCR-Cbeta or CD3epsilon. These results argue against a simple aggregation model for TCR signaling and suggest that the stalks of the CD3 proteins may be critical in transmitting part of the activation signal directly through the membrane.
Conflict of interest statement
The authors have declared that no competing interests exist.
Figures


Similar articles
-
Constitutively oxidized CXXC motifs within the CD3 heterodimeric ectodomains of the T cell receptor complex enforce the conformation of juxtaposed segments.J Biol Chem. 2014 Jul 4;289(27):18880-92. doi: 10.1074/jbc.M114.574996. Epub 2014 May 21. J Biol Chem. 2014. PMID: 24849600 Free PMC article.
-
Solution structure of the CD3epsilondelta ectodomain and comparison with CD3epsilongamma as a basis for modeling T cell receptor topology and signaling.Proc Natl Acad Sci U S A. 2004 Nov 30;101(48):16867-72. doi: 10.1073/pnas.0407576101. Epub 2004 Nov 19. Proc Natl Acad Sci U S A. 2004. PMID: 15557001 Free PMC article.
-
Specific requirement for CD3epsilon in T cell development.Proc Natl Acad Sci U S A. 1998 Dec 8;95(25):14909-14. doi: 10.1073/pnas.95.25.14909. Proc Natl Acad Sci U S A. 1998. PMID: 9843989 Free PMC article.
-
Role of CD3ε-mediated signaling in T-cell development and function.Crit Rev Immunol. 2011;31(1):73-84. doi: 10.1615/critrevimmunol.v31.i1.70. Crit Rev Immunol. 2011. PMID: 21395513 Review.
-
Allosteric Changes Underlie the Outside-In Transmission of Activatory Signals in the TCR.Immunol Rev. 2025 Jan;329(1):e13438. doi: 10.1111/imr.13438. Immunol Rev. 2025. PMID: 39754405 Review.
Cited by
-
Development of T cell lines sensitive to antigen stimulation.J Immunol Methods. 2018 Nov;462:65-73. doi: 10.1016/j.jim.2018.08.011. Epub 2018 Aug 28. J Immunol Methods. 2018. PMID: 30165064 Free PMC article.
-
Pseudomonas aeruginosa and Its Bacterial Components Influence the Cytokine Response in Thymocytes and Splenocytes.Infect Immun. 2016 Apr 22;84(5):1413-1423. doi: 10.1128/IAI.00905-15. Print 2016 May. Infect Immun. 2016. PMID: 26902726 Free PMC article.
-
TCR Nanoclusters as the Framework for Transmission of Conformational Changes and Cooperativity.Front Immunol. 2012 May 9;3:115. doi: 10.3389/fimmu.2012.00115. eCollection 2012. Front Immunol. 2012. PMID: 22582078 Free PMC article.
-
Lipid-dependent conformational dynamics underlie the functional versatility of T-cell receptor.Cell Res. 2017 Apr;27(4):505-525. doi: 10.1038/cr.2017.42. Epub 2017 Mar 24. Cell Res. 2017. PMID: 28337984 Free PMC article.
-
Structural basis of assembly of the human T cell receptor-CD3 complex.Nature. 2019 Sep;573(7775):546-552. doi: 10.1038/s41586-019-1537-0. Epub 2019 Aug 28. Nature. 2019. PMID: 31461748
References
-
- Malissen B, Ardouin L, Lin S. Y, Gillet A, Malissen M. Function of the CD3 subunits of the pre-TCR and TCR complexes during T cell development. Adv Immunol. 1999;72:103–148. - PubMed
-
- Clevers H, Alarcon B, Wileman T, Terhorst C. The T cell receptor/CD3 complex: a dynamic protein ensemble. Annu Rev Immunol. 1988;6:629–662. - PubMed
-
- Alarcon B, Berkhout B, Breitmeyer J, Terhorst C. Assembly of the human T cell receptor-CD3 complex takes place in the endoplasmic reticulum and involves intermediary complexes between the CD3-gamma.delta.epsilon core and single T cell receptor alpha or beta chains. J Biol Chem. 1988;263:2953–2961. - PubMed
-
- San Jose E, Sahuquillo A. G, Bragado R, Alarcon B. Assembly of the TCR/CD3 complex: CD3 epsilon/delta and CD3 epsilon/gamma dimers associate indistinctly with both TCR alpha and TCR beta chains. Evidence for a double TCR heterodimer model. Eur J Immunol. 1998;28:12–21. - PubMed
-
- Sancho J, Chatila T, Wong R. C, Hall C, Blumberg R, et al. T-cell antigen receptor (TCR)-alpha/beta heterodimer formation is a prerequisite for association of CD3-zeta 2 into functionally competent TCR.CD3 complexes. J Biol Chem. 1989;264:20760–20769. - PubMed
Publication types
MeSH terms
Substances
Grants and funding
LinkOut - more resources
Full Text Sources
Molecular Biology Databases
