

Maize centromere structure and evolution: sequence analysis of centromeres 2 and 5 reveals dynamic Loci shaped primarily by retrotransposons
- PMID: 19956743
- PMCID: PMC2776974
- DOI: 10.1371/journal.pgen.1000743
Maize centromere structure and evolution: sequence analysis of centromeres 2 and 5 reveals dynamic Loci shaped primarily by retrotransposons
Abstract
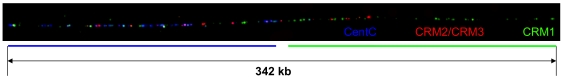
We describe a comprehensive and general approach for mapping centromeres and present a detailed characterization of two maize centromeres. Centromeres are difficult to map and analyze because they consist primarily of repetitive DNA sequences, which in maize are the tandem satellite repeat CentC and interspersed centromeric retrotransposons of maize (CRM). Centromeres are defined epigenetically by the centromeric histone H3 variant, CENH3. Using novel markers derived from centromere repeats, we have mapped all ten centromeres onto the physical and genetic maps of maize. We were able to completely traverse centromeres 2 and 5, confirm physical maps by fluorescence in situ hybridization (FISH), and delineate their functional regions by chromatin immunoprecipitation (ChIP) with anti-CENH3 antibody followed by pyrosequencing. These two centromeres differ substantially in size, apparent CENH3 density, and arrangement of centromeric repeats; and they are larger than the rice centromeres characterized to date. Furthermore, centromere 5 consists of two distinct CENH3 domains that are separated by several megabases. Succession of centromere repeat classes is evidenced by the fact that elements belonging to the recently active recombinant subgroups of CRM1 colonize the present day centromeres, while elements of the ancestral subgroups are also found in the flanking regions. Using abundant CRM and non-CRM retrotransposons that inserted in and near these two centromeres to create a historical record of centromere location, we show that maize centromeres are fluid genomic regions whose borders are heavily influenced by the interplay of retrotransposons and epigenetic marks. Furthermore, we propose that CRMs may be involved in removal of centromeric DNA (specifically CentC), invasion of centromeres by non-CRM retrotransposons, and local repositioning of the CENH3.
Conflict of interest statement
The authors have declared that no competing interests exist.
Figures


Similar articles
-
Maize centromeres: organization and functional adaptation in the genetic background of oat.Plant Cell. 2004 Mar;16(3):571-81. doi: 10.1105/tpc.018937. Epub 2004 Feb 18. Plant Cell. 2004. PMID: 14973167 Free PMC article.
-
Centromeric retroelements and satellites interact with maize kinetochore protein CENH3.Plant Cell. 2002 Nov;14(11):2825-36. doi: 10.1105/tpc.006106. Plant Cell. 2002. PMID: 12417704 Free PMC article.
-
Stable centromere positioning in diverse sequence contexts of complex and satellite centromeres of maize and wild relatives.Genome Biol. 2017 Jun 21;18(1):121. doi: 10.1186/s13059-017-1249-4. Genome Biol. 2017. PMID: 28637491 Free PMC article.
-
Complex structure of knobs and centromeric regions in maize chromosomes.Tsitol Genet. 2000 Mar-Apr;34(2):11-5. Tsitol Genet. 2000. PMID: 10857197 Review.
-
A molecular view of plant centromeres.Trends Plant Sci. 2003 Dec;8(12):570-5. doi: 10.1016/j.tplants.2003.10.011. Trends Plant Sci. 2003. PMID: 14659705 Review.
Cited by
-
De novo centromere formation on a chromosome fragment in maize.Proc Natl Acad Sci U S A. 2013 Apr 9;110(15):6033-6. doi: 10.1073/pnas.1303944110. Epub 2013 Mar 25. Proc Natl Acad Sci U S A. 2013. PMID: 23530217 Free PMC article.
-
The compact Brachypodium genome conserves centromeric regions of a common ancestor with wheat and rice.Funct Integr Genomics. 2010 Nov;10(4):477-92. doi: 10.1007/s10142-010-0190-3. Epub 2010 Sep 15. Funct Integr Genomics. 2010. PMID: 20842403
-
Pan-centromere reveals widespread centromere repositioning of soybean genomes.Proc Natl Acad Sci U S A. 2023 Oct 17;120(42):e2310177120. doi: 10.1073/pnas.2310177120. Epub 2023 Oct 10. Proc Natl Acad Sci U S A. 2023. PMID: 37816061 Free PMC article.
-
Centromere Satellite Repeats Have Undergone Rapid Changes in Polyploid Wheat Subgenomes.Plant Cell. 2019 Sep;31(9):2035-2051. doi: 10.1105/tpc.19.00133. Epub 2019 Jul 16. Plant Cell. 2019. PMID: 31311836 Free PMC article.
-
Accessible DNA and relative depletion of H3K9me2 at maize loci undergoing RNA-directed DNA methylation.Plant Cell. 2014 Dec;26(12):4903-17. doi: 10.1105/tpc.114.130427. Epub 2014 Dec 2. Plant Cell. 2014. PMID: 25465407 Free PMC article.
References
-
- San Miguel P, Gaut B, Tikhonov A, Nakajima Y, Bennetzen JL. The paleontology of intergene retrotransposons of maize. Nature Genetics. 1998;20:43–45. - PubMed
-
- Schnable PS, Ware D, Fulton RS, Stein JC, Wei F, et al. The B73 maize genome: complexity, diversity and dynamics. Science. 2009;326 doi:1126/science.1178534. - PubMed
Publication types
MeSH terms
Substances
LinkOut - more resources
Full Text Sources
