. 2009 Nov;5(11):e1000739.
doi: 10.1371/journal.pgen.1000739. Epub 2009 Nov 26.

Cohesin is required for higher-order chromatin conformation at the imprinted IGF2-H19 locus

Affiliations

Cohesin is required for higher-order chromatin conformation at the imprinted IGF2-H19 locus

Raffaella Nativio et al. PLoS Genet. 2009 Nov.

Abstract

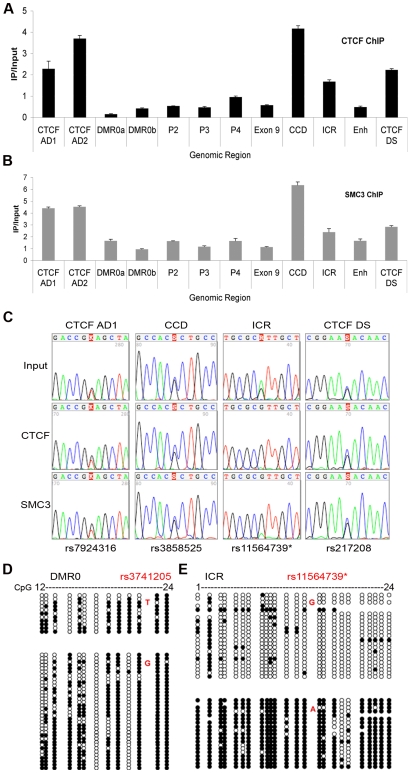
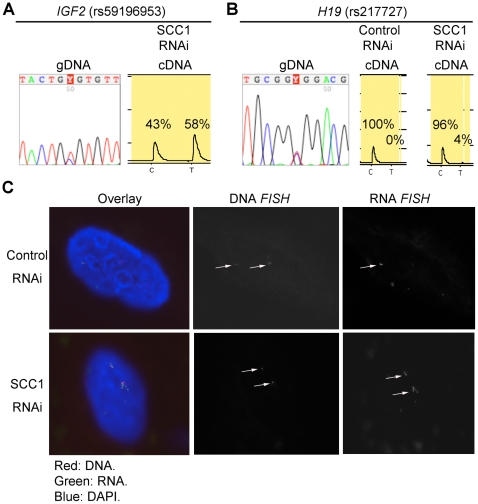
Cohesin is a chromatin-associated protein complex that mediates sister chromatid cohesion by connecting replicated DNA molecules. Cohesin also has important roles in gene regulation, but the mechanistic basis of this function is poorly understood. In mammalian genomes, cohesin co-localizes with CCCTC binding factor (CTCF), a zinc finger protein implicated in multiple gene regulatory events. At the imprinted IGF2-H19 locus, CTCF plays an important role in organizing allele-specific higher-order chromatin conformation and functions as an enhancer blocking transcriptional insulator. Here we have used chromosome conformation capture (3C) assays and RNAi-mediated depletion of cohesin to address whether cohesin affects higher order chromatin conformation at the IGF2-H19 locus in human cells. Our data show that cohesin has a critical role in maintaining CTCF-mediated chromatin conformation at the locus and that disruption of this conformation coincides with changes in IGF2 expression. We show that the cohesin-dependent, higher-order chromatin conformation of the locus exists in both G1 and G2 phases of the cell cycle and is therefore independent of cohesin's function in sister chromatid cohesion. We propose that cohesin can mediate interactions between DNA molecules in cis to insulate genes through the formation of chromatin loops, analogous to the cohesin mediated interaction with sister chromatids in trans to establish cohesion.


Conflict of interest statement

The authors have declared that no competing interests exist.

Figures

Figure 1
Figure 1. Schematic representation of the IGF2-H19 locus.
(A) The Insulin (INS), Insulin-like Growth Factor 2 (IGF2), and H19 genes (blue boxes) are displayed together with the downstream enhancer (Enh; green oval). CTCF/cohesin binding regions are indicated by red rectangles, BamHI restriction sites by vertical blue lines, and 3C restriction sites (3C RS) by letters. The 3C elements (yellow triangles) represent regions analysed by 3C; the IGF2 upstream region (CTCF AD/DMR0), the Centrally Conserved DNase I hypersensitive domain (CCD), the Imprinting Control Region (ICR), the H19 downstream enhancers, and a CTCF binding Downstream Site (CTCF DS). (B–F) Enlargements of the 3C elements and surrounding genomic areas indicating primer positions relative to restriction sites. Anchor primers are indicated with dark arrows, reciprocal 3C primers with grey arrowheads, and primers used for SNP analysis with open arrowheads. (B) Enlarged region of the IGF2 gene. The IGF2 upstream region is composed of the CTCF region adjacent to DMR0 (CTCF AD; red box) and the DMR0 (yellow bar). Promoters (P1 to P4), exons (empty boxes for non-coding and blue boxes for coding), and single nucleotide polymorphisms (SNP; rs numbers) are indicated. Red type and underlying bars represent ChIP amplicons. The closest BamHI restriction site to the CTCF AD is restriction site a. Restriction site b1 is within DMR0, but is also close to the P2 promoter. Restriction sites b2, c1, c2, and d are between the P2 and P3 promoters. (C) Detail of the DMR0 region to indicate SNP positions in the a-b1 restriction fragment. (D) The intervening region between IGF2 and H19 showing the position of the CCD relative to restriction sites e to h. (E) Enlargement of the ICR (yellow bar) and H19 gene (open boxes). Restriction sites i to k lie in the CTCF binding regions (red box) and ICR rs115647398* is a SNP in HB2 that is 2 bp away from the annotated rs115647398. (F) Detail of the enhancers region and CTCF DS. Primer information is available in Table S2 and Table S3.
Figure 2
Figure 2. CTCF and the cohesin binding at IGF2-H19 region in HB2 cells.
(A) Enrichment of PCR products from CTCF bound regions in the HB2 cell line over the Input (IP/Input). (B) Enrichment (IP/Input) of cohesin at same regions. Strong enrichment for CTCF and cohesin is seen at the CTCF sites adjacent to DMR0 (CTCF AD1 and 2), the CCD and a CTCF downstream of H19 (CTCF DS). Error bars represent standard deviations of 3 replicate PCRs. (C) SNP analysis of CTCF and cohesin ChIP for the CTCF sites adjacent to DMR0, (CTCF AD1), the CCD, ICR, and the CTCF DS. Enriched sequences for CTCF and cohesin binding are biallelic for the CTCF site adjacent to DMR0 and to the CCD at the given SNPs. At the ICR, the G-allele at rs11564739* was preferentially enriched after CTCF and cohesin ChIP. (D) Methylation status of the DMR0 and (E) the ICR. Each horizontal group of circles represents a single sequence. Specific alleles identified by the SNPs shown in red are grouped. Each circle represents a single CpG. Gaps between circles indicate that the CpGs are not adjacent. Open circles represent unmethylated CpGs, filled circles represent methylated CpGs. The allele that binds CTCF at the ICR is the unmethylated G-allele.
Figure 3
Figure 3. Chromatin conformation of the IGF2-H19 locus is conserved between G1 and G2 phase of the cell cycle.
(A) Schematic representation of a 350 Kb genomic region including INS and the IGF2-H19 locus. Blue boxes represent the position of genes and the green oval depicts the localisation of the enhancer (Enh) (see also Figure 1). Similarly, red boxes in the second line represent the CTCF/cohesin binding regions CTCF AD, CCD, ICR, and CTCF DS. Vertical blue lines indicate the position of BamHI restriction sites within the locus and letters point out the restriction sites analysed by 3C (3C RS) in the graphs and histograms shown in (B, D, F, G). The blue vertical lines in (B, D, F, G) link the positions of the restriction sites used as anchors in the different panels with the overview of the locus in (A). Thicker vertical lines indicate the position of the anchor in the respective graph. The anchor restriction sites fragments are: b1 in the CTCF AD/DMR0 region, k in the ICR, m in the enhancer and q in the CTCF DS region. The X-axis is labelled according to genomic position and position 0 was arbitrarily fixed 42 Kb upstream of INS. (B) Associations detected with the anchor site in the ICR (primer k). An association is present between the ICR and the CTCF AD/DMR0 region in both G1 and G2 phase and with the CTCF DS preferentially in G2. (C) The peak of association frequencies between the ICR and CTCF AD/DMR0 compared to random ligation (f–k) is shown in the histogram. Restriction site a is adjacent to the CTCF AD region (Figure 1) and the high association frequency between a and k might reflect directly the CTCF/cohesin binding to the CTCF AD. (D) Associations detected with an anchor in the enhancer (primer m). Peaks indicating interactions between the enhancer and the CTCF AD/DMR0 region can be seen in G1 and G2 phase cells. Positions of primers P2 and P3 are indicated. (E) The peak of association frequencies between the enhancer and CTCF AD/DMR0 region is shown in the histogram. Association values at restriction sites a–m report on the CTCF AD/DMR0 interaction with the enhancer, while b2-m, c1-m and d–m report on the IGF2 promoters P2 and P3. (F) Associations with the CTCF AD/DMR0 region (restriction site b1 as anchor site). Very high association frequencies are visible for the interactions with the CCD and the distant CTCF DS in G1 and G2 phase cells, presumably due to the strong and biallelic binding of CTCF and cohesin at these sites. (G) Associations of the CTCF DS region (q anchor) throughout the locus during G2 phase. Reciprocal association peaks with the CTCF AD/DMR0 and the CCD are visible.
Figure 4
Figure 4. 3C-SNP analysis.
(A–E) show SNP sequencing results with electropherograms of the sequence and allele ratios by pyrosequencing (PSQ) analysis. A diagram indicating the 3C ligation product with the orientation of primers and SNPs is given below each sequence result. (A) 3C ligation product of restriction sites a and m which represents DMR0 and the enhancer showing preferentially monoallelic interaction at a SNP within fragment a-b1. The a-b1 fragment is close to the P0 and P2 promoters in the flanking BamHI fragments. (Promoters can extend up to 5 Kb upstream of the transcription start site and the resolution of the 3C technique does not enable distinction between different promoters when they are in close proximity). (B) SNP analysis of 3C ligation product of restriction sites c2 and m representing an interaction between the enhancer and IGF2 promoters near restriction site c2. Both SNPs in this region show monoallelic interactions. (C) Allelic analysis of 3C ligation product of restriction sites a and h, using a SNP near restriction site h in the CCD shows that associations between CTCF AD/DMR0 and CCD are biallelic. This SNP also showed that CTCF bound to both alleles at the CCD in Figure 2. (D) SNP analysis of 3C ligation product of restriction sites k and q indicative of an interaction between the ICR and the downstream CTCF DS showing a monoallelic interaction. (E) SNP analysis of 3C ligation products between ICR and the CTCF AD/DMR0 (restriction sites a–k). Both sides of the hybrid product show biallelic associations.
Figure 5
Figure 5. ChIP–loop experiments indicate that CTCF and cohesin are present at the interactions between CTCF AD/DMR0 and the ICR.
Agarose gel showing a PCR product of 272 bp amplified with primers for the ICR and CTCFAD/DMR0 (primers at j and b1 restriction sites in Figure 1A) and a PCR product of 303 bp amplified with primers for the enhancer and CTCFAD/DMR0 (primers at m and b1 restriction sites in Figure 1A). Templates in each panel include 3C standard (template from PCR standard curve), 3C (cross-linked chromatin BamHI digested and ligated), α-CTCF-3C, and α-SMC3-3C (ChIP–loop templates that were immuno-precipitated with CTCF or cohesin antibodies prior to ligation). ICR interactions are found in 3C and ChIP-loop material, likely reflecting a specific CTCF/cohesin mediated association between CTCF AD and the ICR, with both proteins present in the loop. In contrast, enhancer interactions are not found in ChIP–loop material confirming that this interaction is not CTCF/cohesin dependent and reflecting an association between the enhancer and the P2 promoter rather than with DMR0.
Figure 6
Figure 6. Cell-cycle synchronisation and siRNA depletion of cohesin.
For cohesin depletion experiments, cells were transfected with RNAi against SCC1. RNAi against luciferase was used as a control. (A) Plots of FACS sorted cells synchronised in G1- and G2-phase in control and cohesin depleted cells. (B) Western blots showing SCC1 protein levels after RNAi treatment (C). SMC3 ChIP on G2 cells after cohesin depletion showing that cohesin is reduced at the ICR and the CTCF DS sites. (D) Expression levels of IGF2 and H19 relative to β-actin, as determined by real time PCR after cohesin depletion in G1 and G2 phases. IGF2 is significantly upregulated while H19 levels are unaffected. # Denotes significant differences (P<0.05) between control and SCC1 RNAi. (E) DNA methylation levels of individual CpGs in the DMR0 and ICR were determined by pyrosequencing of bisulphite modified DNA from cohesin depleted cells and controls in G2 phase. (F) Average DNA methylation levels at all CpGs detected by pyrosequencing in Figure 6E shows that methylation was not significantly changed after RNAi treatment for SCC1. Box and whisker plots show mean, inter-quartile ranges, max, and min values. Data represent triplicate bisulphite conversion and pyrosequencing reactions from one RNAi and control experiment.
Figure 7
Figure 7. Depletion of cohesin by siRNA results in ablation of the CTCF-mediated loops.
(A) Schematic representation of a 350 Kb genomic region including INS and the IGF2-H19 locus as shown in Figure 3. (B) Associations detected with an anchor site in the ICR (primer k) in G2 phase cells treated with control RNAi (G2 control) or RNAi against the cohesin subunit SCC1 (SCC1 RNAi). Association between the ICR and CTCF/cohesin sites, i.e. CTCF AD, CCD, and CTCF DS, are reduced in SCC1 depleted cells indicating a general “loosening” of the chromatin structure. (C) Histogram of association frequencies between ICR anchor and restriction sites at the CTCF AD/DMR0 peak. (D) Enhancer associations (m primer) after cohesin RNAi are not generally reduced. Reduction at the intervening CCD and ICR sites may be due to the influence of disrupted associations at CTCF/cohesin bound sites. (E) Histogram of association frequencies between Enh anchor and restriction sites at the CTCF AD/DMR0 peak. (F) Sequencing of b1-m interaction shows a change from mono-allelic interactions in controls to biallelic interactions after cohesin depletion. (G) Association frequencies of CTCF AD/DMR0 (restriction site b1 as anchor) show a significant reduction in the association with CCD. (H) Histogram representing reduction in CTCF AD/DMR0 -CCD (h-b1) association after cohesin depletion. Table S1 has statistical analysis of all interactions between anchor primers and BamHI sites. # Denotes significant differences (P<0.05) between control and SCC1 RNAi.
Figure 8
Figure 8. Biallelic IGF2 expression after cohesin depletion.
(A) Sequencing of genomic DNA (gDNA) shows that the HB2 cell line is heterozygous for a SNP in IGF2. Pyrosequencing of cDNA of cohesin depleted G2 phase cells shows both IGF2 alleles indicating biallelic IGF2 expression. (B) Sequencing of genomic DNA (gDNA) shows that the HB2 cell line is heterozygous for a SNP in H19. Pyrosequencing of cDNA of cohesin depleted and control G2 cells shows only the C allele indicating that H19 expression remains monoallelic after cohesin depletion. (C) After labelling IGF2 RNA by RNA fluorescence in situ hybridisation (FISH; green) on cohesin depleted (SCC1 RNAi) and control interphase HB2 cells (RNAi control), DNA FISH (red) was performed to detect genomic IGF2 sequence. Nuclei were counterstained with DAPI (blue) and imaged by confocal microscopy. Representative images are shown; first panel: overlay, second panel: DNA signal, third panel: RNA signal. IGF2 expression increases and becomes biallelic upon cohesin depletion.
Figure 9
Figure 9. Simplified model of the cohesin and CTCF–mediated interactions in the human IGF2-H19 locus.
DNA elements are indicated as follows: CTCF AD (red bar); CCD (green bar), ICR (purple bar), and CTCF DS (Cerise bar), Enhancer is yellow oval. Pink and pale blue ovals represent the CTCF/cohesin complexes. CpG methylation is depicted as filled lollipops. (A) Linear representation of the IGF2-H19 locus. Elements above the bar represent the maternal allele with CTCF and cohesin binding the ICR and an active H19 gene. Elements below the bar represent the paternal allele with active IGF2 gene and methylated ICR. ChIP data indicate that cohesin and CTCF co-localise at the CCD, CTCF AD and CTCF DS on both alleles. 3C data indicate that these CTCF/cohesin sites interact strongly with each other; while the ICR and enhancer have limited allele specific interactions (long curved arrows indicate 3C interactions between 3C elements). Based on these data we propose the following model: (B) On the paternal allele, co-localisation of CTCF and cohesin at CTCF AD, CCD, and CTCF DS brings these regions together. The methylated ICR does not bind CTCF and is thus excluded from CTCF/cohesin interacting regions. The exclusion of the ICR may enable the IGF2 gene promoters and H19 enhancer region to interact, (shown by yellow oval close to IGF2 arrow) even though they are on different looping domains. (The H19 domain is shaded.) (C) On the maternal allele, CTCF/cohesin can bind to the unmethylated ICR which can then interact with other CTCF/cohesin sites. An interaction between CTCF AD/DMR0 and the ICR may be indirectly mediated through the interaction between CTCF AD/DMR0 and CTCF DS. A monoallelic interaction between the ICR and CTCF DS could redefine the H19 domain and constrain the enhancer to prevent interaction with IGF2 promoters on the maternal allele. Without cohesin, CTCF does not maintain stable loops and IGF2 promoters can access the enhancers and perhaps even other regulatory elements from neighbouring genes. Interactions between the various CTCF sites are likely to be dynamic and may occur sequentially.

References

    1. Peters JM, Tedeschi A, Schmitz J. The cohesin complex and its roles in chromosome biology. Genes Dev. 2008;22:3089–3114. - PubMed
    1. Haering CH, Farcas AM, Arumugam P, Metson J, Nasmyth K. The cohesin ring concatenates sister DNA molecules. Nature. 2008;454:297–301. - PubMed
    1. Dorsett D. Roles of the sister chromatid cohesion apparatus in gene expression, development, and human syndromes. Chromosoma. 2007;116:1–13. - PMC - PubMed
    1. Pauli A, Althoff F, Oliveira RA, Heidmann S, Schuldiner O, et al. Cell-type-specific TEV protease cleavage reveals cohesin functions in Drosophila neurons. Dev Cell. 2008;14:239–251. - PMC - PubMed
    1. Schuldiner O, Berdnik D, Levy JM, Wu JS, Luginbuhl D, et al. piggyBac-based mosaic screen identifies a postmitotic function for cohesin in regulating developmental axon pruning. Dev Cell. 2008;14:227–238. - PMC - PubMed

Publication types