. 2009 Nov;7(11):e1000247.
doi: 10.1371/journal.pbio.1000247. Epub 2009 Nov 24.

Linking human diseases to animal models using ontology-based phenotype annotation

Affiliations

Linking human diseases to animal models using ontology-based phenotype annotation

Nicole L Washington et al. PLoS Biol. 2009 Nov.

Abstract

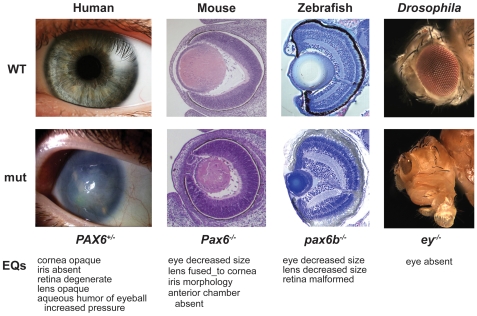
Scientists and clinicians who study genetic alterations and disease have traditionally described phenotypes in natural language. The considerable variation in these free-text descriptions has posed a hindrance to the important task of identifying candidate genes and models for human diseases and indicates the need for a computationally tractable method to mine data resources for mutant phenotypes. In this study, we tested the hypothesis that ontological annotation of disease phenotypes will facilitate the discovery of new genotype-phenotype relationships within and across species. To describe phenotypes using ontologies, we used an Entity-Quality (EQ) methodology, wherein the affected entity (E) and how it is affected (Q) are recorded using terms from a variety of ontologies. Using this EQ method, we annotated the phenotypes of 11 gene-linked human diseases described in Online Mendelian Inheritance in Man (OMIM). These human annotations were loaded into our Ontology-Based Database (OBD) along with other ontology-based phenotype descriptions of mutants from various model organism databases. Phenotypes recorded with this EQ method can be computationally compared based on the hierarchy of terms in the ontologies and the frequency of annotation. We utilized four similarity metrics to compare phenotypes and developed an ontology of homologous and analogous anatomical structures to compare phenotypes between species. Using these tools, we demonstrate that we can identify, through the similarity of the recorded phenotypes, other alleles of the same gene, other members of a signaling pathway, and orthologous genes and pathway members across species. We conclude that EQ-based annotation of phenotypes, in conjunction with a cross-species ontology, and a variety of similarity metrics can identify biologically meaningful similarities between genes by comparing phenotypes alone. This annotation and search method provides a novel and efficient means to identify gene candidates and animal models of human disease, which may shorten the lengthy path to identification and understanding of the genetic basis of human disease.


Conflict of interest statement

The authors have declared that no competing interests exist.

Figures

Figure 1
Figure 1. Representation of phenotypes.
Phenotypes of wild-type (top) and PAX6 ortholog mutations (bottom) in human, mouse, zebrafish, and fly can be described with the EQ method. EQ annotations of the abnormal phenotypes are listed below each set of images per organism. Note that the anatomical entities are from ssAOs and qualities are from the PATO ontology. These PAX6 phenotypes have been described textually as follows. Human mutations may result in aniridia (absence of iris), corneal opacity (aniridia-related keratopathy), cataract (lens clouding), glaucoma, and long-term retinal degeneration. For mouse, the mutants exhibit extreme microphthalmia with lens/corneal opacity and iris abnormality, and there is a large plug of persistent epithelial cells that remains attached between the cornea and the lens. For zebrafish, the mutants express a variable and modifiable phenotype that consists of decreased eye size, reduced lens size, and malformation of the retina. Drosophila ey (a PAX6 ortholog) mutations cause loss of eye development. The genotypes shown are E15 mouse Pax614Neu/14Neu , 5 day zebrafish pax6btq253a/tq253a , human PAX6+/ , and Drosophila ey−/− .
Figure 2
Figure 2. Ontology subsumption reasoning.
This example shows the relationships of the term “intestinal epithelium” to other anatomical entities within the ZFA ontology. Gray arrows with an “i” indicate an is_a relation, and blue arrows with a “p” indicate a part_of relation. The numbers indicate IC of the node, which is the negative log of the probability of that description being used to annotate a gene, allele, or genotype (collectively called a feature). As terms get more general, reading from bottom to top, they have a lower IC score because the more general terms subsume the annotations made to more specific terms.
Figure 3
Figure 3. Subsumption reasoning EQ descriptions.
The relationship between an EQ description and its contributing ontologies (flanking panels) are shown. The entities are from the ZFA ontology in blue, and the qualities from PATO in green. The full EQ hierarchy (all possible EQ combinations) between ZFA:ceratohyal cartilage + PATO:mislocalized ventrally and ZFA:cranial cartilage + PATO:position are shown, illustrating subsumption across graph nodes comprised of multiple ontology terms. Relationships are as indicated in Figure 2. As with the single ontology in Figure 2, IC scores can be calculated for EQ nodes, where more general EQ nodes having a lower score than more specific EQs.
Figure 4
Figure 4. Phenotypic profile comparison and phenotype promotion.
Multiple EQ descriptions annotated to a genotype comprise a phenotypic profile, and these profiles can be compared using subsumption logic. Phenotypes annotated to genotypes are propagated to their allele(s), and in turn to the gene, indicated with upward arrows. Similarity is analyzed between any two nodes of the same type, such as between gene A-vs-B, allele A3-vs-B1, genotypes A1/A1-vs-A3/A3, or A3/A3-vs-B1/B1. Genotypes are shown as rounded boxes, alleles as circles, and genes as squares. The phenotypic profile of genotype A1/A1 is detailed in purple, genotype A3/A3 in blue, and B1/B1 in red. The common subsuming phenotypes between A1/A1-vs-A3/A3 and gene A-vs-B are itemized in white boxes. Arrows between the original phenotypic descriptions and their common subsuming phenotypic description are indicated. Some individual phenotypic descriptions can have two common subsumers. For each phenotypic description (EQ), the calculated IC is shown. When comparing two items, four scores are determined: maxIC, the maximum IC score for the common subsuming EQ, which may be a direct (in the case of A1/A1-vs-A3/A3) or inferred (in the case of gene A-vs-gene B) phenotype, circled in red; avgICCS, the average of all common subsuming IC scores; simIC, the similarity score which computes the ratio of the sum of IC values for EQ descriptions (including subsuming descriptions) held in common (intersection) to that of the total set (union); simJ, non-IC-based similarity score calculated with the Jaccard algorithm which is the ratio of the count of all nodes in common to nodes not in common. These scores are also indicated for the comparisons between alleles A3-vs-B1 and A3/A3-vs-B1/B1, although the full profile is not being shown.
Figure 5
Figure 5. Similarity metrics analysis of phenotype profiles between and within genes.
Each of the four panels shows one of the four similarity measurements, comparing the score for alleles of the same gene (intra, in black) versus alleles of all other genes (inter, in gray), for each of the 11 OMIM genes annotated. The average of all 11 OMIM gene comparisons for each similarity metric are shown in the grayed portion of the graph on the right. Metrics are (as described in Figure 4): (A) simIC, (B) simJ, (C) ICCS, and (D) maxIC. For each metric, there was a significantly higher similarity value (p<0.0001) for the intra-genic comparisons as compared to the inter-genic comparisons. Significance was tested using a two-tailed Student's t-test, for the pairwise comparison (intra versus inter) for all four metrics for each gene. Error bars are standard error of the mean.
Figure 6
Figure 6. A similarity search for mutant phenotypes similar to zebrafish shha retrieves many known pathway members.
Based on the diagram from KEGG , the double gray line represents the plasma membrane, and the dashed line the nuclear membrane. All known shha pathway members are shown; those with recorded mutant EQ annotations are yellow. Pathway members retrieved in the top 23 most similar genes are indicated by red boxes. Known pathway members in ZFIN are shown with their current nomenclature, with the exception of those with uninformative nomenclature, which are listed with their KEGG reference gene family nomenclature and are capitalized. KEGG reference pathway members not yet identified in zebrafish (Fu) are grayed out.
Figure 7
Figure 7. UBERON links multiple species-specific anatomy ontologies.
The entities for selected human, zebrafish, and mouse EYA1 phenotypes were annotated using species-specific anatomy ontologies (FMA, ZFA, and MA, respectively) as indicated by the solid squares. Outlined squares indicate entities of subsuming annotations, color coded to match the source ontology. Annotations can be associated with common subsuming nodes via UBERON. In this example, each of the annotated entities can be linked through the UBERON:ear (black).

Similar articles

Cited by

References

    1. Holloway E. From genotype to phenotype: linking bioinformatics and medical informatics ontologies. Comp Funct Genomics. 2002;3:447–450. - PMC - PubMed
    1. Schuhmacher A. J, Guerra C, Sauzeau V, Canamero M, Bustelo X. R, et al. A mouse model for Costello syndrome reveals an Ang II-mediated hypertensive condition. J Clin Invest. 2008;118:2169–2179. - PMC - PubMed
    1. Collin G. B, Marshall J. D, Ikeda A, So W. V, Russell-Eggitt I, et al. Mutations in ALMS1 cause obesity, type 2 diabetes and neurosensory degeneration in Alstrom syndrome. Nat Genet. 2002;31:74–78. - PubMed
    1. Arsov T, Silva D. G, O'Bryan M. K, Sainsbury A, Lee N. J, et al. Fat aussie–a new Alstrom syndrome mouse showing a critical role for ALMS1 in obesity, diabetes, and spermatogenesis. Mol Endocrinol. 2006;20:1610–1622. - PubMed
    1. Hamosh A, Scott A. F, Amberger J. S, Bocchini C. A, McKusick V. A. Online Mendelian Inheritance in Man (OMIM), a knowledgebase of human genes and genetic disorders. Nucleic Acids Res. 2005;33:D514–D517. - PMC - PubMed

Publication types