. 2009;10(12):R138.
doi: 10.1186/gb-2009-10-12-r138. Epub 2009 Dec 3.

Non-imprinted allele-specific DNA methylation on human autosomes

Affiliations

Non-imprinted allele-specific DNA methylation on human autosomes

Yingying Zhang et al. Genome Biol. 2009.

Abstract

Background: Differential DNA methylation between alleles is well established in imprinted genes and the X chromosomes in females but has rarely been reported at non-imprinted loci on autosomes.

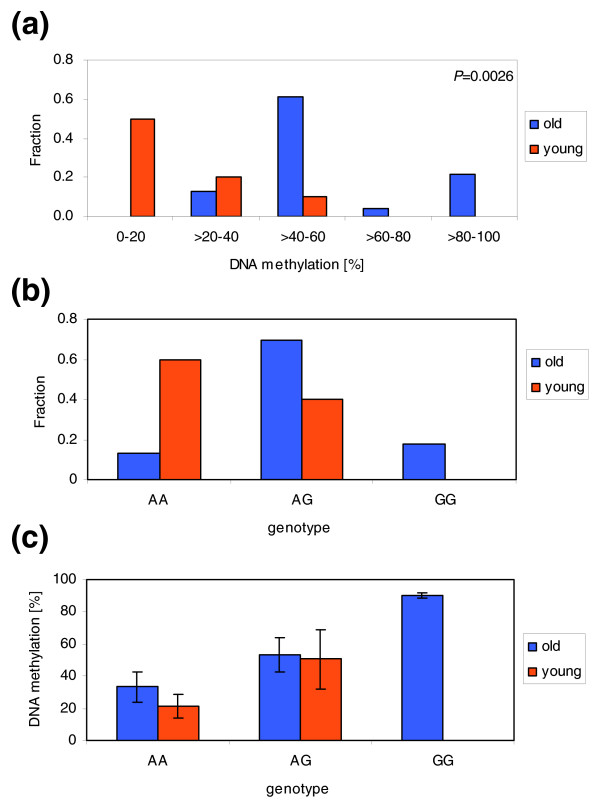
Results: We studied DNA methylation of cytosine-guanine dinucleotide (CpG) islands on chromosome 21 in leukocytes from several healthy individuals and observed novel cases of pronounced differential methylation of alleles. Allele-specific methylation affected complete CpG islands with methylation differences between alleles of up to 85%. The methylation differences between alleles were strongly correlated with the genotypes, excluding a connection to imprinting. We show that allele-specific methylation can lead to allelic repression of the methylated gene copy. Based on our results, allele-specific methylation is likely to affect about 10% of all human genes and to contribute to allele-specific expression and monoallelic gene silencing. Therefore, allele-specific methylation represents an epigenetic pathway of how genetic polymorphisms may lead to phenotypic variability. In most cases, we observed that some, but not all, heterozygous individuals showed allele-specific methylation, suggesting that allele-specific methylation is the outcome of an epigenetic drift, the direction of which is determined by the genetic differences between the alleles. We could show that the tendency to acquire hypermethylation in one allele was inherited.

Conclusions: We observed that larger differences in methylation levels between individuals were often coupled to allele-specific methylation and genetic polymorphisms, suggesting that the inter-individual variability of DNA methylation is strongly influenced by genetic differences. Therefore, genetic differences must be taken into account in future comparative DNA methylation studies.


Figures

Figure 1
Figure 1
Inter-individual variation of DNA methylation. (a) DNA methylation levels of all amplicons studied in blood from ten old (1 to 10) and ten young (11 to 20) individuals. The data were sorted by the average level of DNA methylation among amplicons and individuals. Old individuals are represented by black numbers, young individuals by red numbers. The continuous yellow to blue color code represents the DNA methylation level of the PCR products. (b) Average DNA methylation level of all 16 amplicons among 20 individuals (1 to 20). The error bars indicate the standard deviation among the samples. Amplicon 262 was split into 262_L (left part) and 262_R (right part) because of the different methylation observed in these two parts. Green color labeled amplicons showed a maximal methylation difference between individuals of more than 50%; orange labels indicate amplicons with >30% methylation difference. (c) DNA methylation pattern of amplicon 23_1 in individuals 1 to 20. Each column represents a single CpG site. Each row corresponds to one individual.
Figure 2
Figure 2
Allele-specific methylation and expression of amplicons 23_1 and 23_2. (a) Example of ASM of amplicons 23_1 and 23_2 in the first exon of gene C21orf81. The figure shows the position of these two amplicons in the UCSC genome browser and the methylation pattern of alleles in both amplicons. Each row corresponds to one clone of bisulfite PCR products. Each column corresponds to one CpG site in the studied region. The color code indicates different methylation states of the CpG sites (blue, unmethylated; red, methylated; white, methylation state unknown). The clones in each amplicon were sorted according to their genotype at two SNPs (dbsnp rs56270809 on 23_2 and dbsnp rs2297246 on 23_1), the positions of which are indicated by an arrow. By sequencing of the genomic DNA we identified the haplotype of all samples with ASM to be either A/A or C/C as schematically shown in the lower part of the figure. Expression analysis showed that the gene is exclusively expressed from the unmethylated A allele (indicated by an asterisk) in leukocytes (data are shown from individual 11). (b) Compilation of results from all heterozygous individuals in amplicon 23_1. The individuals were sorted according to the decreasing methylation difference between alleles. Each row corresponds to a single allele from one individual. Each square represents the average methylation of a CpG site encoded in a continuous yellow to blue color code. The original methylation patterns of all samples with ASM are shown in Additional file 4. (c) Methylation level of each allele from all heterozygous individuals in amplicon 23_1. (d) Compilation of results from all heterozygous individuals in amplicon 23_2. The original methylation patterns of all samples with ASM are shown in Additional file 4. (e) Methylation level of each allele from all heterozygous individuals in amplicon 23_2.
Figure 3
Figure 3
ASM of amplicon 262. (a) Example of ASM of amplicon 262. The figure shows the position of the amplicon in the UCSC genome browser, the positions of the SNP (dbsnp rs2838343) used to discriminate alleles, and the allelic methylation, basically as described in the legend to Figure 2a. The line indicates the border between the methylated and unmethylated part of the amplicon. Sequencing of cDNA showed that the gene is biallelically expressed (data are shown from individual 10). (b) Compilation of results from all heterozygous individuals. Two patterns of ASM were observed in amplicon 262. The line indicates the border between the methylated and unmethylated parts of the amplicon. For further details see the legend to Figure 2b. The original methylation patterns of all samples with ASM are shown in Additional file 5. (c) Methylation level of each allele from all heterozygous individuals. For this analysis the amplicon was split into two pieces corresponding to its left part (28 CpG sites) or right part (14 CpG sites). The data labeled with ASM_1 refer to the right part of the amplicon, ASM_2 refers to the left part and no ASM refers to the full amplicon. (d) Methylation levels of homozygous individuals with A/A or G/G genotypes compared with the methylation levels of A or G alleles from heterozygous individuals. In this analysis the results obtained for individual 2_L were included. The error bars indicate the standard rrror of the mean. After omission of 2_L, the methylation levels of the A and G alleles from A/G heterozygous individuals were 28% and 79%, respectively.
Figure 4
Figure 4
ASM of amplicon 232. (a) Example of ASM of amplicon 232. The figure shows the position of the amplicon in UCSC genome browser, the positions of the SNP (dbsnp rs55860816) used to discriminate alleles, and the allelic methylation, basically as described in the legend to Figure 2a. The correlation of the SNP in this amplicon (dbsnp rs55860816) and a SNP (rs6586238) in the first exon of the gene as identified by sequencing of genomic DNA is schematically shown in the lower part of the figure. SNP (rs6586238) was used to discriminate alleles in gene expression analysis. Sequencing of cDNA showed that the gene is biallelically expressed in leukocytes. (b) Compilation of results from all heterozygous individuals. For further details see the legend to Figure 2b. (c) Methylation level of each allele from all heterozygous individuals. The original methylation patterns of all samples with ASM are shown in Additional file 7.
Figure 5
Figure 5
Correlation of DNA methylation with age in amplicon 262. (a) Methylation of amplicon 262 in old and young individuals analyzed without considering genotypes. An age-related highly significant increase in methylation appears to be detected. (b) Distribution of A and G genotypes among old and young individuals in our study. (c) Comparison of DNA methylation in old and young individuals with the same genotypes. This panel shows a re-analysis of the data plotted in (a); error bar represent the standard deviations of the data. This representation of the data clearly indicates that there is no age-related gain of methylation in this amplicon.

References

    1. Reik W. Stability and flexibility of epigenetic gene regulation in mammalian development. Nature. 2007;447:425–432. doi: 10.1038/nature05918. - DOI - PubMed
    1. Klose RJ, Bird AP. Genomic DNA methylation: the mark and its mediators. Trends Biochem Sci. 2006;31:89–97. doi: 10.1016/j.tibs.2005.12.008. - DOI - PubMed
    1. Goll MG, Bestor TH. Eukaryotic cytosine methyltransferases. Annu Rev Biochem. 2005;74:481–514. doi: 10.1146/annurev.biochem.74.010904.153721. - DOI - PubMed
    1. Reik W, Walter J. Evolution of imprinting mechanisms: the battle of the sexes begins in the zygote. Nat Genet. 2001;27:255–256. doi: 10.1038/85804. - DOI - PubMed
    1. Wilkins JF. Genomic imprinting and methylation: epigenetic canalization and conflict. Trends Genet. 2005;21:356–365. doi: 10.1016/j.tig.2005.04.005. - DOI - PubMed

Publication types

LinkOut - more resources