

A microarray analysis of sex- and gonad-biased gene expression in the zebrafish: evidence for masculinization of the transcriptome
- PMID: 19958554
- PMCID: PMC2797025
- DOI: 10.1186/1471-2164-10-579
A microarray analysis of sex- and gonad-biased gene expression in the zebrafish: evidence for masculinization of the transcriptome
Abstract
Background: In many taxa, males and females are very distinct phenotypically, and these differences often reflect divergent selective pressures acting on the sexes. Phenotypic sexual dimorphism almost certainly reflects differing patterns of gene expression between the sexes, and microarray studies have documented widespread sexually dimorphic gene expression. Although the evolutionary significance of sexual dimorphism in gene expression remains unresolved, these studies have led to the formulation of a hypothesis that male-driven evolution has resulted in the masculinization of animal transcriptomes. Here we use a microarray assessment of sex- and gonad-biased gene expression to test this hypothesis in zebrafish.
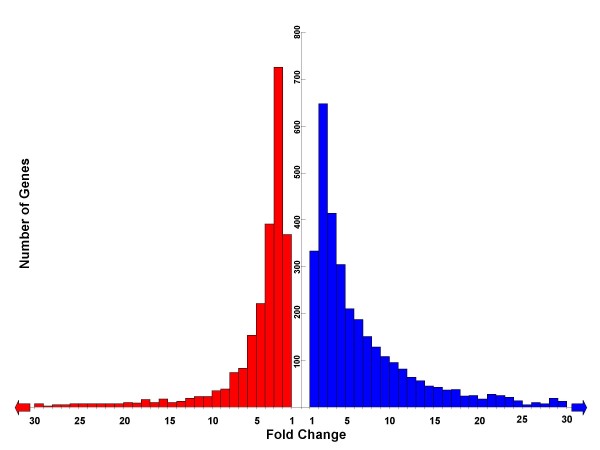
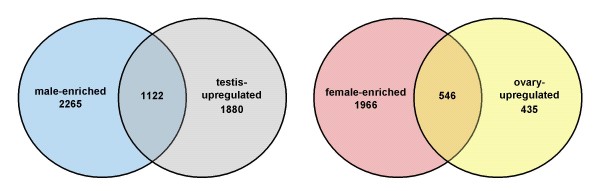
Results: By using zebrafish Affymetrix microarrays to compare gene expression patterns in male and female somatic and gonadal tissues, we identified a large number of genes (5899) demonstrating differences in transcript abundance between male and female Danio rerio. Under conservative statistical significance criteria, all sex-biases in gene expression were due to differences between testes and ovaries. Male-enriched genes were more abundant than female-enriched genes, and expression bias for male-enriched genes was greater in magnitude than that for female-enriched genes. We also identified a large number of genes demonstrating elevated transcript abundance in testes and ovaries relative to male body and female body, respectively.
Conclusion: Overall our results support the hypothesis that male-biased evolutionary pressures have resulted in male-biased patterns of gene expression. Interestingly, our results seem to be at odds with a handful of other microarray-based studies of sex-specific gene expression patterns in zebrafish. However, ours was the only study designed to address this specific hypothesis, and major methodological differences among studies could explain the discrepancies. Regardless, all of these studies agree that transcriptomic sex differences in D. rerio are widespread despite the apparent absence of heterogamety. These differences likely make important contributions to phenotypic sexual dimorphism in adult zebrafish; thus, from an evolutionary standpoint, the precise roles of sex-specific selection and sexual conflict in the evolution of sexually dimorphic gene expression are very important. The results of our study and others like it set the stage for further work aimed at directly addressing this exciting issue in comparative genomics.
Figures
References
-
- Darwin CR. The Descent of Man, and Selection in Relation to Sex. John Murray, London; 1871.
Publication types
MeSH terms
LinkOut - more resources
Full Text Sources
Other Literature Sources
Molecular Biology Databases
