

doi: 10.1016/j.nic.2009.08.009.
Diffusion imaging for therapy response assessment of brain tumor
Affiliations
- PMID: 19959005
- PMCID: PMC4044869
- DOI: 10.1016/j.nic.2009.08.009
Item in Clipboard
Diffusion imaging for therapy response assessment of brain tumor
Neuroimaging Clin N Am.
2009 Nov.
Abstract
Advanced imaging provides insight into biophysical, physiologic, metabolic, or functional properties of tissues. Because water mobility is sensitive to cellular homeostasis, cellular density, and microstructural organization, it is considered a valuable tool in the advanced imaging arsenal. This article summarizes diffusion imaging concepts and highlights clinical applications of diffusion MR imaging for oncologic imaging. Diffusion tensor imaging and its derivative maps of diffusion anisotropy allow assessment of tumor compression or destruction of adjacent normal tissue anisotropy and may aid to assess tumor infiltration and aid presurgical planning.
Figures
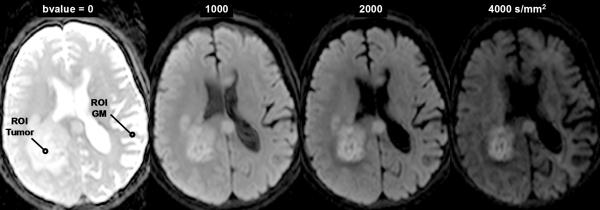
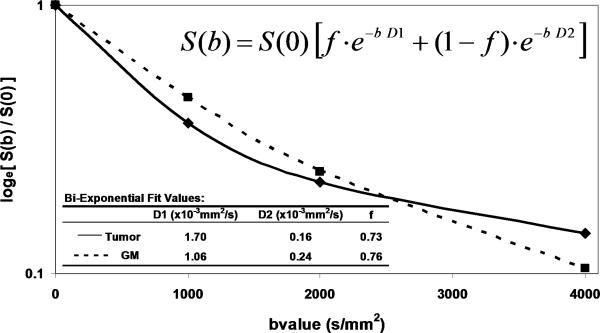
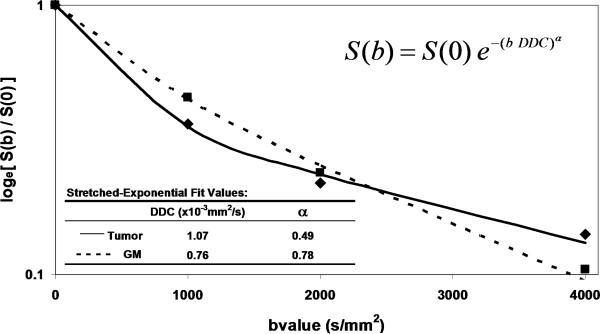
DWI contrast at high b-value in a 61yo patient with a GBM. (A) DWI of the brain typically performed at b-value=0, 1000s/mm2, although conspicuity of cellular dense central tumor increases at higher b-values. (B) Tissue has multiexponential diffusion decay properties as is evident by curvature in log(signal) with b-value which can be fit by a bi-exponential function to yield fast diffusion D1, slow diffusion D2 coefficients and relative fraction of fast diffusion component f. (C) The stretched exponential is an alternative functional form to fit multiexponential decay, where DDC is the distributed diffusion coefficient and a lower α value indicates greater heterogeneity of diffusion contributions in the curve. Both the bi-exponential and stretched exponential fits indicate there is a greater spread in diffusion values in tumor relative to normal grey matter for this patient.
DWI contrast at high b-value in a 61yo patient with a GBM. (A) DWI of the brain typically performed at b-value=0, 1000s/mm2, although conspicuity of cellular dense central tumor increases at higher b-values. (B) Tissue has multiexponential diffusion decay properties as is evident by curvature in log(signal) with b-value which can be fit by a bi-exponential function to yield fast diffusion D1, slow diffusion D2 coefficients and relative fraction of fast diffusion component f. (C) The stretched exponential is an alternative functional form to fit multiexponential decay, where DDC is the distributed diffusion coefficient and a lower α value indicates greater heterogeneity of diffusion contributions in the curve. Both the bi-exponential and stretched exponential fits indicate there is a greater spread in diffusion values in tumor relative to normal grey matter for this patient.
DWI contrast at high b-value in a 61yo patient with a GBM. (A) DWI of the brain typically performed at b-value=0, 1000s/mm2, although conspicuity of cellular dense central tumor increases at higher b-values. (B) Tissue has multiexponential diffusion decay properties as is evident by curvature in log(signal) with b-value which can be fit by a bi-exponential function to yield fast diffusion D1, slow diffusion D2 coefficients and relative fraction of fast diffusion component f. (C) The stretched exponential is an alternative functional form to fit multiexponential decay, where DDC is the distributed diffusion coefficient and a lower α value indicates greater heterogeneity of diffusion contributions in the curve. Both the bi-exponential and stretched exponential fits indicate there is a greater spread in diffusion values in tumor relative to normal grey matter for this patient.
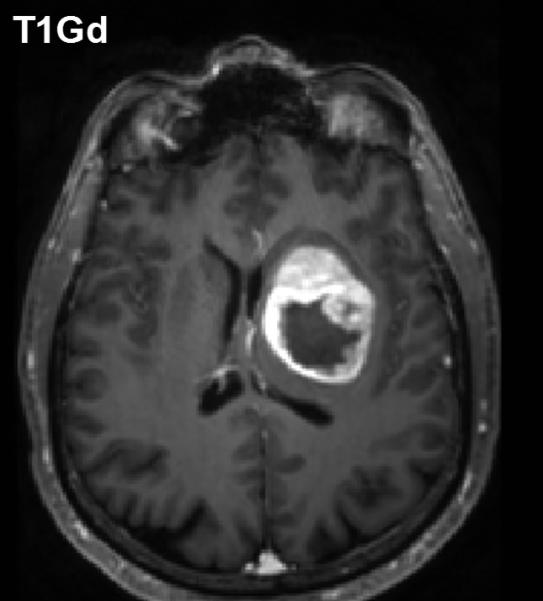
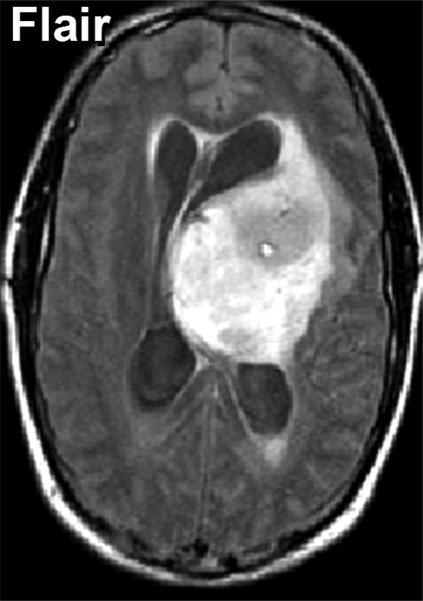
Diffusion anisotropy is typically associated with normal white matter structures but may be induced by tumor mass-effect compression of adjacent tissues. (A) Conventional post-contrast T1wt shows a well-delineated lesion in this 56yo GBM patient. (B) Fractional anisotropy map shows high anisotropy in normal white matter structures as well as anisotropy around surrounding the lesion. (C) Anisotropy shape analysis of DTI eigen values shows linear shaped structures on at CL map based on high contrast between first and second eigen values. (D) Planar shaped anisotropic zones are apparent on the CP map which is based on high contrast between second and third eigen values. The conspicuous rim around the lesion is likely due to compression of cells immediately adjacent to the expanding tumor mass.
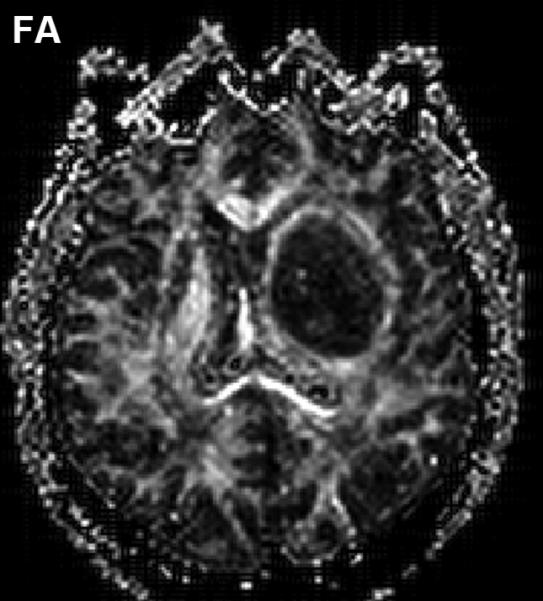
Diffusion anisotropy is typically associated with normal white matter structures but may be induced by tumor mass-effect compression of adjacent tissues. (A) Conventional post-contrast T1wt shows a well-delineated lesion in this 56yo GBM patient. (B) Fractional anisotropy map shows high anisotropy in normal white matter structures as well as anisotropy around surrounding the lesion. (C) Anisotropy shape analysis of DTI eigen values shows linear shaped structures on at CL map based on high contrast between first and second eigen values. (D) Planar shaped anisotropic zones are apparent on the CP map which is based on high contrast between second and third eigen values. The conspicuous rim around the lesion is likely due to compression of cells immediately adjacent to the expanding tumor mass.
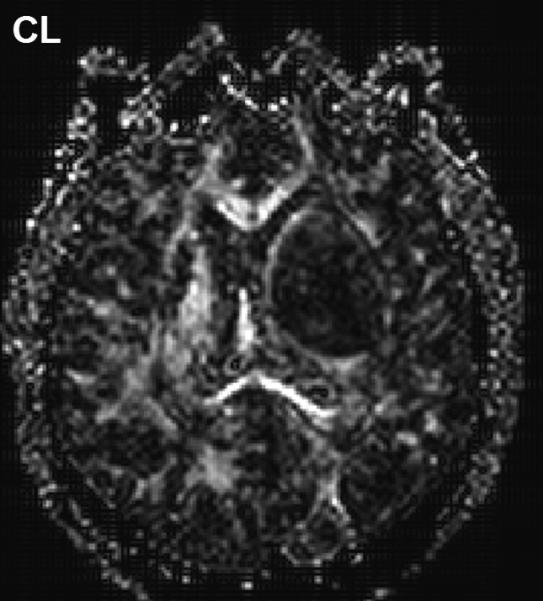
Diffusion anisotropy is typically associated with normal white matter structures but may be induced by tumor mass-effect compression of adjacent tissues. (A) Conventional post-contrast T1wt shows a well-delineated lesion in this 56yo GBM patient. (B) Fractional anisotropy map shows high anisotropy in normal white matter structures as well as anisotropy around surrounding the lesion. (C) Anisotropy shape analysis of DTI eigen values shows linear shaped structures on at CL map based on high contrast between first and second eigen values. (D) Planar shaped anisotropic zones are apparent on the CP map which is based on high contrast between second and third eigen values. The conspicuous rim around the lesion is likely due to compression of cells immediately adjacent to the expanding tumor mass.
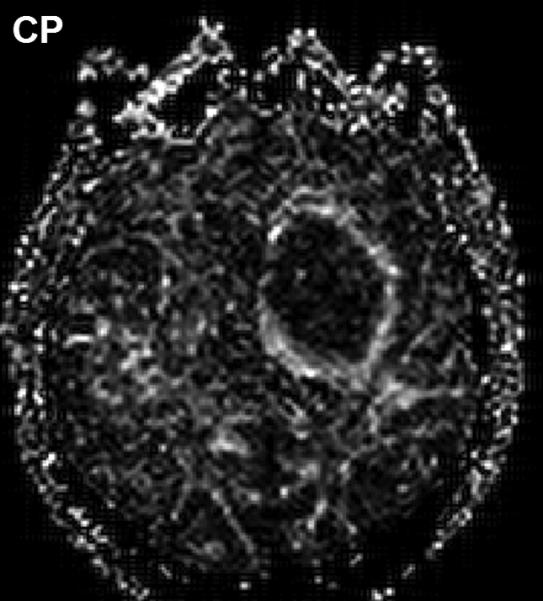
Diffusion anisotropy is typically associated with normal white matter structures but may be induced by tumor mass-effect compression of adjacent tissues. (A) Conventional post-contrast T1wt shows a well-delineated lesion in this 56yo GBM patient. (B) Fractional anisotropy map shows high anisotropy in normal white matter structures as well as anisotropy around surrounding the lesion. (C) Anisotropy shape analysis of DTI eigen values shows linear shaped structures on at CL map based on high contrast between first and second eigen values. (D) Planar shaped anisotropic zones are apparent on the CP map which is based on high contrast between second and third eigen values. The conspicuous rim around the lesion is likely due to compression of cells immediately adjacent to the expanding tumor mass.
Multimodality depiction of a malignant glioma in a 29yo patient. (A) FLAIR contrast MRI shows a large central mass. (B) Cerebral blood flow (CBF) map indicates the tumor is well perfused. (C) Relatively low ADC suggests a high cellular density in the tumor. (D) Choline and NAA maps with extracted spectra indicate high membrane turnover in the tumor. High choline content, high CBF and low ADC are mutually consistent and support the diagnosis of a cellular dense, viable, malignant tumor. This patient expired within 1month after this MRI exam.
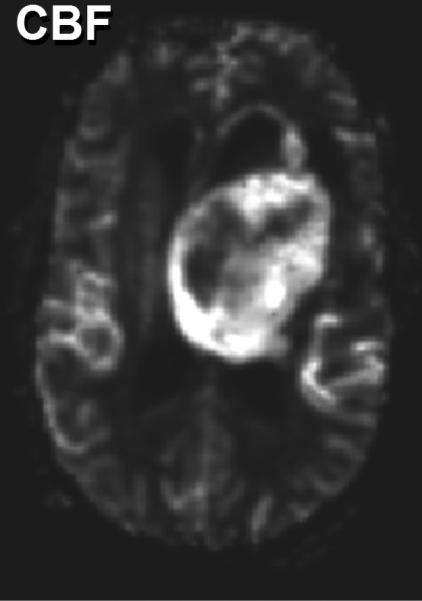
Multimodality depiction of a malignant glioma in a 29yo patient. (A) FLAIR contrast MRI shows a large central mass. (B) Cerebral blood flow (CBF) map indicates the tumor is well perfused. (C) Relatively low ADC suggests a high cellular density in the tumor. (D) Choline and NAA maps with extracted spectra indicate high membrane turnover in the tumor. High choline content, high CBF and low ADC are mutually consistent and support the diagnosis of a cellular dense, viable, malignant tumor. This patient expired within 1month after this MRI exam.
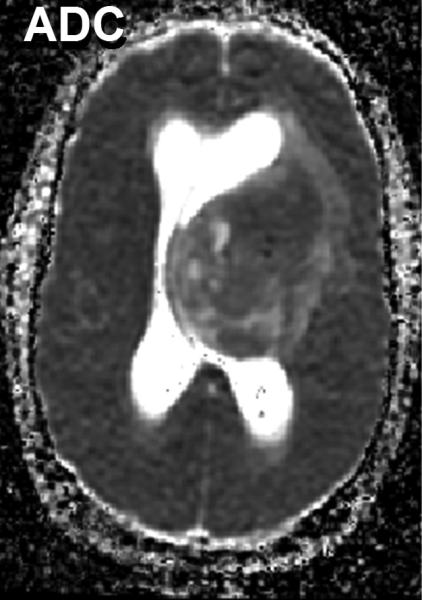
Multimodality depiction of a malignant glioma in a 29yo patient. (A) FLAIR contrast MRI shows a large central mass. (B) Cerebral blood flow (CBF) map indicates the tumor is well perfused. (C) Relatively low ADC suggests a high cellular density in the tumor. (D) Choline and NAA maps with extracted spectra indicate high membrane turnover in the tumor. High choline content, high CBF and low ADC are mutually consistent and support the diagnosis of a cellular dense, viable, malignant tumor. This patient expired within 1month after this MRI exam.
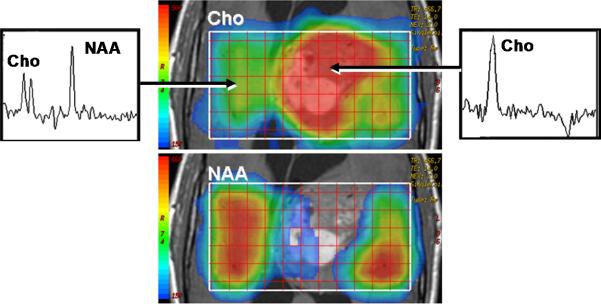
Multimodality depiction of a malignant glioma in a 29yo patient. (A) FLAIR contrast MRI shows a large central mass. (B) Cerebral blood flow (CBF) map indicates the tumor is well perfused. (C) Relatively low ADC suggests a high cellular density in the tumor. (D) Choline and NAA maps with extracted spectra indicate high membrane turnover in the tumor. High choline content, high CBF and low ADC are mutually consistent and support the diagnosis of a cellular dense, viable, malignant tumor. This patient expired within 1month after this MRI exam.
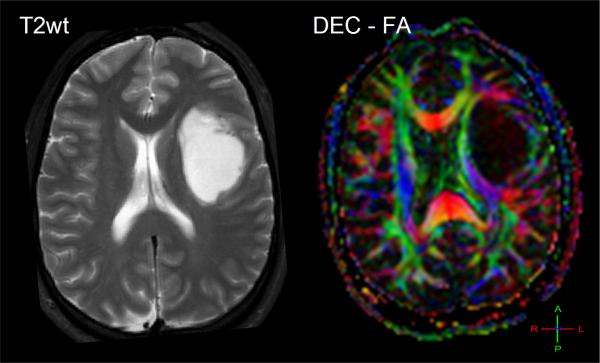
The effect of tumor on normal white matter structures can be studied by directionally-encoded-color FA maps. (A) A 26yo patient with white matter and normal tissues shifted and somewhat compressed by this anaplastic astrocytoma. (B) This 48yo patient has reduced anisotropy and mass effect due to infiltration of his GBM. (C) This 62yo GBM patient has lost all anisotropy in the due to tumor replacement of white matter in portions of the splenium.
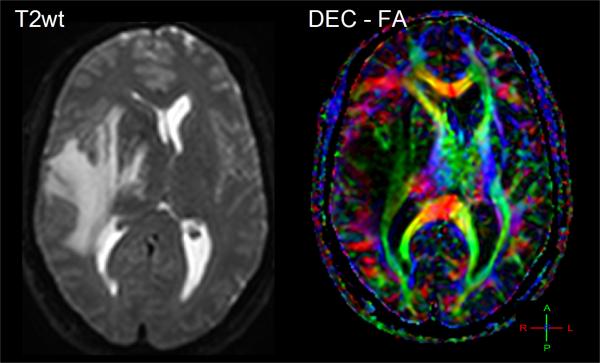
The effect of tumor on normal white matter structures can be studied by directionally-encoded-color FA maps. (A) A 26yo patient with white matter and normal tissues shifted and somewhat compressed by this anaplastic astrocytoma. (B) This 48yo patient has reduced anisotropy and mass effect due to infiltration of his GBM. (C) This 62yo GBM patient has lost all anisotropy in the due to tumor replacement of white matter in portions of the splenium.
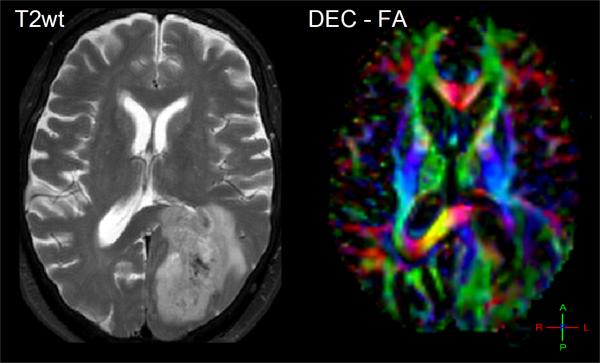
The effect of tumor on normal white matter structures can be studied by directionally-encoded-color FA maps. (A) A 26yo patient with white matter and normal tissues shifted and somewhat compressed by this anaplastic astrocytoma. (B) This 48yo patient has reduced anisotropy and mass effect due to infiltration of his GBM. (C) This 62yo GBM patient has lost all anisotropy in the due to tumor replacement of white matter in portions of the splenium.
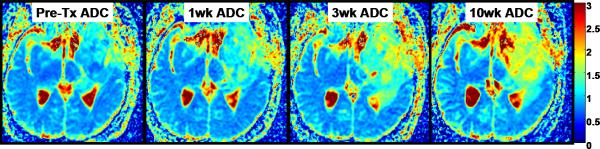
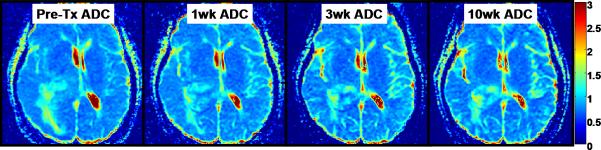
Parametric response map analysis of ADC (PRMADC) of a 45yo GBM patient. (A) Series of co-registered ADC maps one week prior to therapy; and 1, 3 and 10weeks from start of start of chemo-radiotherapy. ADC maps are on a quantitative color scale in units of 10-3mm2/s. (B) Series of PRMADC maps showing an increase in ADC beyond a +0.55×10- 3mm2/s significance threshold as red voxels; or a decrease in ADC by more than −0.55x10⁻³mm2/s as blue voxels and the remainder (non-significant change) as green voxels. These voxels are superimposed on the co-registered T1wt-gad image used to define the tumor volume of interest. PRMADC @1wk, @3wk and @10wk corresponds to ADC changes measured at 1, 3 and 10 weeks from start of therapy relative to pre-therapy baseline. This patient had a relatively large fraction of the tumor that exhibited an increase in ADC early into treatment and was considered a “responder” by PRMADC analysis which was consistent with this patient's 33month survival. Adapted from reference .
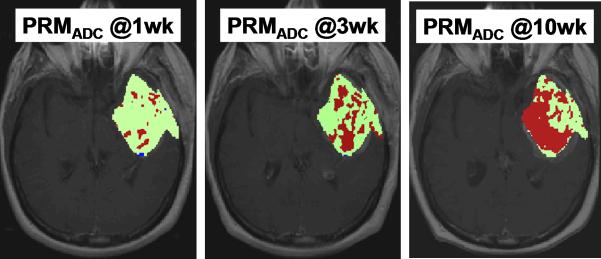
Parametric response map analysis of ADC (PRMADC) of a 45yo GBM patient. (A) Series of co-registered ADC maps one week prior to therapy; and 1, 3 and 10weeks from start of start of chemo-radiotherapy. ADC maps are on a quantitative color scale in units of 10-3mm2/s. (B) Series of PRMADC maps showing an increase in ADC beyond a +0.55×10- 3mm2/s significance threshold as red voxels; or a decrease in ADC by more than −0.55x10⁻³mm2/s as blue voxels and the remainder (non-significant change) as green voxels. These voxels are superimposed on the co-registered T1wt-gad image used to define the tumor volume of interest. PRMADC @1wk, @3wk and @10wk corresponds to ADC changes measured at 1, 3 and 10 weeks from start of therapy relative to pre-therapy baseline. This patient had a relatively large fraction of the tumor that exhibited an increase in ADC early into treatment and was considered a “responder” by PRMADC analysis which was consistent with this patient's 33month survival. Adapted from reference .
Parametric response map analysis of ADC (PRMADC) of a 53yo GBM patient. (A) Series of co-registered ADC maps one week prior to therapy; and 1, 3 and 10weeks from start of start of chemo-radiotherapy. ADC maps are on a quantitative color scale in units of 10-3mm2/s. (B) Series of PRMADC maps showing an increase in ADC beyond a +0.55×10- 3mm2/s significance threshold as red voxels; or a decrease in ADC by more than −0.55x10⁻³mm2/s as blue voxels and the remainder (non- significant change) as green voxels. These voxels are superimposed on the co-registered T1wt-gad image used to define the tumor volume of interest. PRMADC @1wk, @3wk and @10wk corresponds to ADC changes measured at 1, 3 and 10 weeks from start of therapy relative to pre-therapy baseline. This patient had a relatively small fraction of the tumor that exhibited an increase in ADC early into treatment and was considered a “non responder” by PRMADC analysis which was consistent with this patient's 7month survival. Adapted from reference .
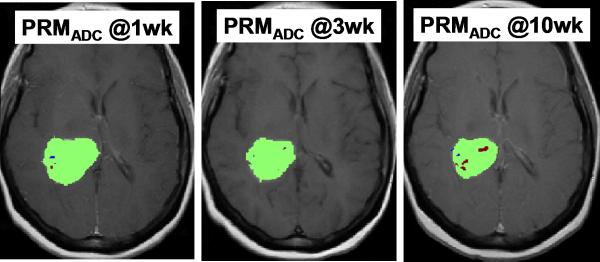
Parametric response map analysis of ADC (PRMADC) of a 53yo GBM patient. (A) Series of co-registered ADC maps one week prior to therapy; and 1, 3 and 10weeks from start of start of chemo-radiotherapy. ADC maps are on a quantitative color scale in units of 10-3mm2/s. (B) Series of PRMADC maps showing an increase in ADC beyond a +0.55×10- 3mm2/s significance threshold as red voxels; or a decrease in ADC by more than −0.55x10⁻³mm2/s as blue voxels and the remainder (non- significant change) as green voxels. These voxels are superimposed on the co-registered T1wt-gad image used to define the tumor volume of interest. PRMADC @1wk, @3wk and @10wk corresponds to ADC changes measured at 1, 3 and 10 weeks from start of therapy relative to pre-therapy baseline. This patient had a relatively small fraction of the tumor that exhibited an increase in ADC early into treatment and was considered a “non responder” by PRMADC analysis which was consistent with this patient's 7month survival. Adapted from reference .
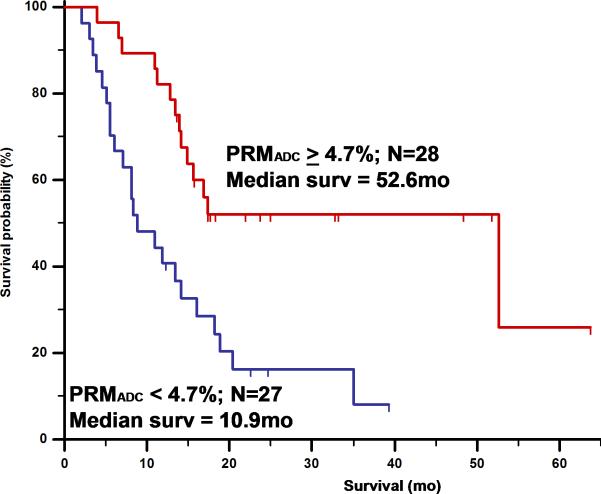
Overall survival by log-rank test based on PRMADC stratification of 55 high grade glioma patients at 3 weeks from start of treatment. PRMADC at 3 weeks from start of treatment was found to be at least as predictive of conventional lesion sized-based response criteria measured at 10weeks. Adapted from reference : Hamstra, D.A., et al., J Clin Oncol, 2008. 26(20): p. 3387-94.
References
-
- Horner MJ, Ries LAG, Krapcho M, et al. SEER Cancer Statistics Review, 1975-2006. National Cancer Institute; Bethesda, MD.: 2009.
-
- Hegi ME, Diserens AC, Gorlia T, et al. MGMT gene silencing and benefit from temozolomide in glioblastoma. N Engl J Med. 2005;352(10):997–1003. - PubMed
-
- Keles GE, Chang EF, Lamborn KR, et al. Volumetric extent of resection and residual contrast enhancement on initial surgery as predictors of outcome in adult patients with hemispheric anaplastic astrocytoma. J Neurosurg. 2006;105(1):34–40. - PubMed
-
- Sanai N, Berger MS. Glioma extent of resection and its impact on patient outcome. Neurosurgery. 2008;62(4):753–64. discussion 264-6. - PubMed
-
- Gaspar LE, Scott C, Murray K, et al. Validation of the RTOG recursive partitioning analysis (RPA) classification for brain metastases. Int J Radiat Oncol Biol Phys. 2000;47(4):1001–6. - PubMed
Publication types
MeSH terms
Grants and funding
LinkOut - more resources
Full Text Sources
Medical
