MR spectroscopy of the liver: principles and clinical applications
- PMID: 19959513
- PMCID: PMC6939847
- DOI: 10.1148/rg.296095520
MR spectroscopy of the liver: principles and clinical applications
Abstract
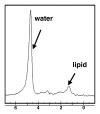
Magnetic resonance (MR) spectroscopy allows the demonstration of relative tissue metabolite concentrations along a two- or three-dimensional spectrum based on the chemical shift phenomenon. An MR spectrum is a plot of the signal intensity and frequency of a chemical or metabolite within a given voxel. At proton MR spectroscopy, the frequency at which a chemical or compound occurs depends on the configuration of the protons within the structure of that chemical. At in vivo proton MR spectroscopy, the frequency location of water is used as the standard of reference to identify a chemical. The frequency shift or location of chemicals relative to that of water allows generation of qualitative and quantitative information about the chemicals that occur within tissues, forming the basis of tissue characterization by MR spectroscopy. MR spectroscopy also may be used to quantify liver fat by measuring lipid peaks and to diagnose malignancy, usually by measuring the choline peak. Interpretation of MR spectroscopic data requires specialized postprocessing software and is subject to technical limitations including low signal-to-noise ratio, masking of metabolite peaks by dominant water and lipid peaks, partial-volume averaging from other tissue within the voxel, and phase and frequency shifts from motion. MR spectroscopy of the liver is an evolving technology with potential for improving the diagnostic accuracy of tissue characterization when spectra are interpreted in conjunction with MR images.
Figures


Similar articles
-
Review of magnetic resonance spectroscopy in the liver and the pancreas.Top Magn Reson Imaging. 2009 Apr;20(2):89-97. doi: 10.1097/RMR.0b013e3181c422f1. Top Magn Reson Imaging. 2009. PMID: 20010063 Review.
-
Assessment of in vivo 1H magnetic resonance spectroscopy in the liver: a review.Liver Int. 2008 Mar;28(3):297-307. doi: 10.1111/j.1478-3231.2007.01647.x. Liver Int. 2008. PMID: 18290772 Review.
-
FID modulus: a simple and efficient technique to phase and align MR spectra.MAGMA. 2014 Apr;27(2):131-48. doi: 10.1007/s10334-013-0381-8. Epub 2013 Jun 21. MAGMA. 2014. PMID: 23794131
-
Non-water-suppressed proton MR spectroscopy improves spectral quality in the human spinal cord.Magn Reson Med. 2013 May;69(5):1253-60. doi: 10.1002/mrm.24387. Epub 2012 Jun 28. Magn Reson Med. 2013. PMID: 22745036
-
Preliminary observations and diagnostic value of lipid peak in ovarian thecomas/fibrothecomas using in vivo proton MR spectroscopy at 3T.J Magn Reson Imaging. 2012 Oct;36(4):907-11. doi: 10.1002/jmri.23711. Epub 2012 May 14. J Magn Reson Imaging. 2012. PMID: 22585396
Cited by
-
Lessons learnt from pathologic imaging correlation in the liver: an historical perspective.Br J Radiol. 2019 May;92(1097):20180701. doi: 10.1259/bjr.20180701. Epub 2019 Jan 10. Br J Radiol. 2019. PMID: 30604641 Free PMC article. Review.
-
Evaluation of Proton MR Spectroscopy for the Study of the Tongue Tissue in Healthy Subjects and Patients With Tongue Squamous Cell Carcinoma: Preliminary Findings.Front Oral Health. 2022 Jul 18;3:912803. doi: 10.3389/froh.2022.912803. eCollection 2022. Front Oral Health. 2022. PMID: 35924279 Free PMC article.
-
Spectroscopy-based multi-parametric quantification in subjects with liver iron overload at 1.5T and 3T.Magn Reson Med. 2022 Feb;87(2):597-613. doi: 10.1002/mrm.29021. Epub 2021 Sep 23. Magn Reson Med. 2022. PMID: 34554595 Free PMC article.
-
Magnetic resonance imaging and spectroscopy for differential assessment of liver abnormalities induced by Opisthorchis felineus in an animal model.PLoS Negl Trop Dis. 2017 Jul 14;11(7):e0005778. doi: 10.1371/journal.pntd.0005778. eCollection 2017 Jul. PLoS Negl Trop Dis. 2017. PMID: 28708894 Free PMC article.
-
The influence of liver fat deposition on the quantification of the liver-iron fraction using fast-kilovolt-peak switching dual-energy CT imaging and material decomposition technique: an in vitro experimental study.Quant Imaging Med Surg. 2019 Apr;9(4):654-661. doi: 10.21037/qims.2019.04.06. Quant Imaging Med Surg. 2019. PMID: 31143656 Free PMC article.
References
-
- Ross BD, Colletti P, Lin A. MR spectroscopy of the brain: neurospectroscopy. In: , Edelman RR, Hesselink JR, Zlatkin MB, Crues JV, eds. Clinical magnetic resonance imaging. 3rd ed Philadelphia, Pa: Saunders-Elsevier, 2006; 1840–1910.
-
- Pagani E, Bizzi A, Di Salle F, De Stefano N, Filippi M. Basic concepts of advanced MRI technique. Neurol Sci 2008;29:290–295. - PubMed
-
- Leach MO. Magnetic resonance spectroscopy (MRS) in the investigation of cancer at The Royal Marsden Hospital and The Institute of Cancer Research. Phys Med Biol 2006;51:R61–R82. - PubMed
-
- Danielsen ER, Ross BD. Magnetic resonance spectroscopy diagnosis of neurological diseases. New York, NY: Marcel Dekker, 1999.
-
- Frahm J, Bruhn H, Gyngell ML. Localized high resolution proton NMR spectroscopy using stimulated echoes: initial applications to human brain in vivo. Magn Reson Med 1989;9:79–93. - PubMed
MeSH terms
Substances
Grants and funding
LinkOut - more resources
Full Text Sources
Medical

