. 2009 Oct;29(6):1797-810.
doi: 10.1148/rg.296095521.

Diffusion-weighted imaging in the abdomen and pelvis: concepts and applications

Affiliations

Diffusion-weighted imaging in the abdomen and pelvis: concepts and applications

Aliya Qayyum. Radiographics. 2009 Oct.

Abstract

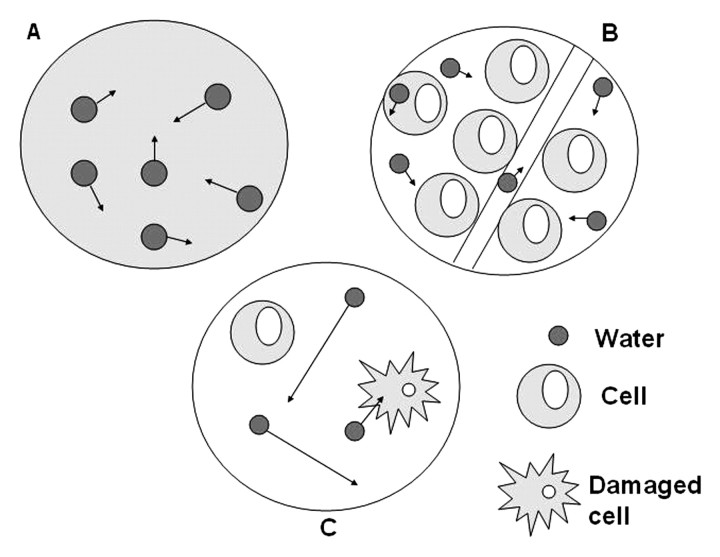
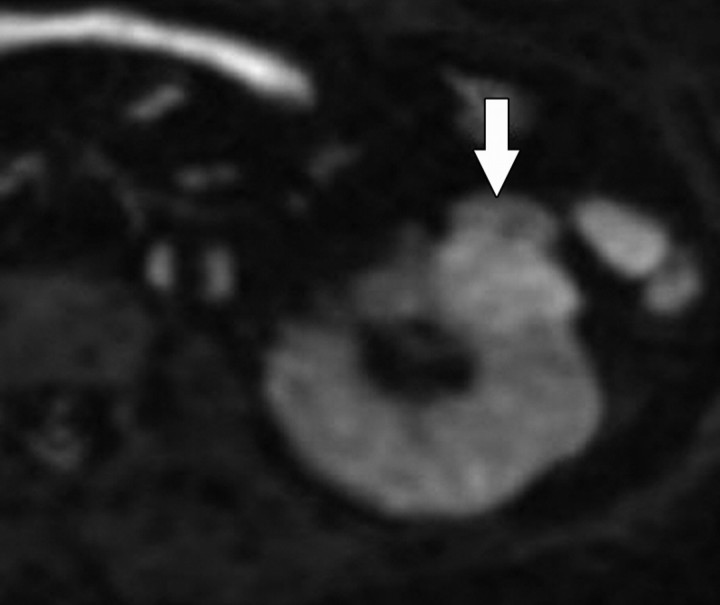
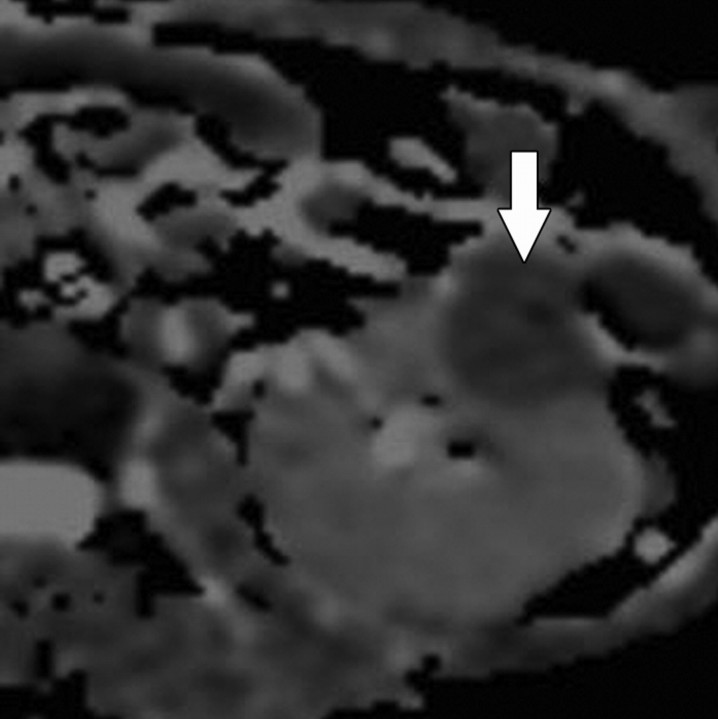
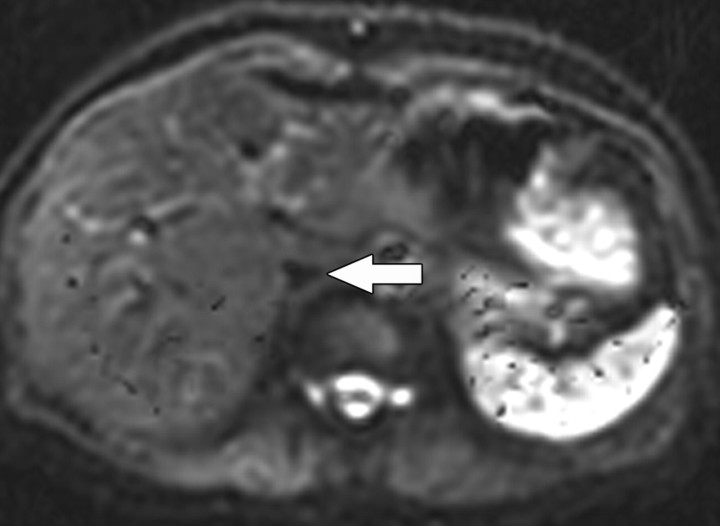
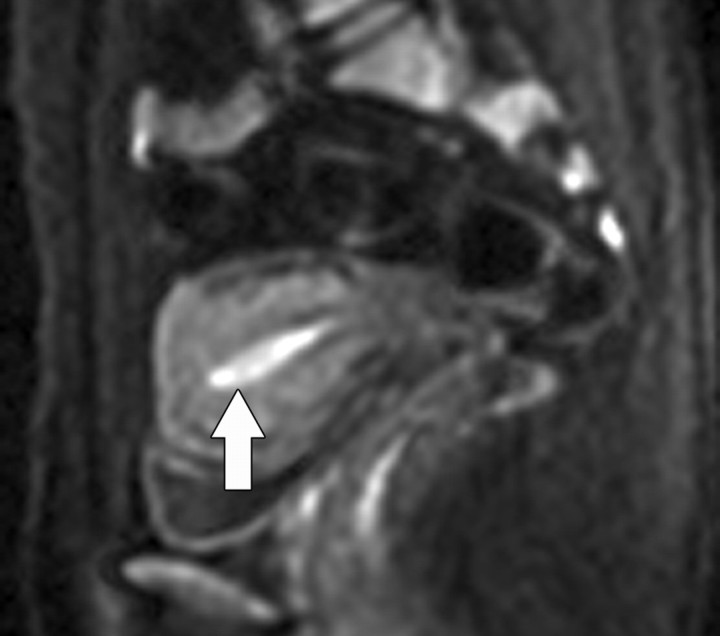
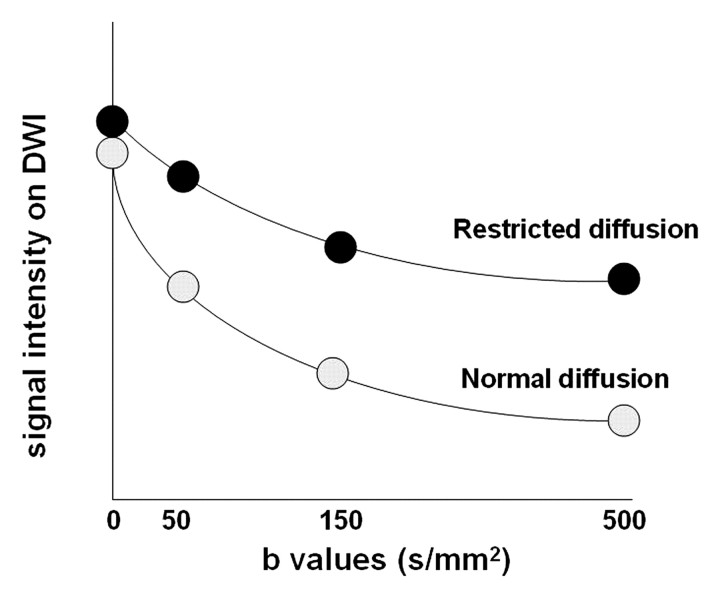
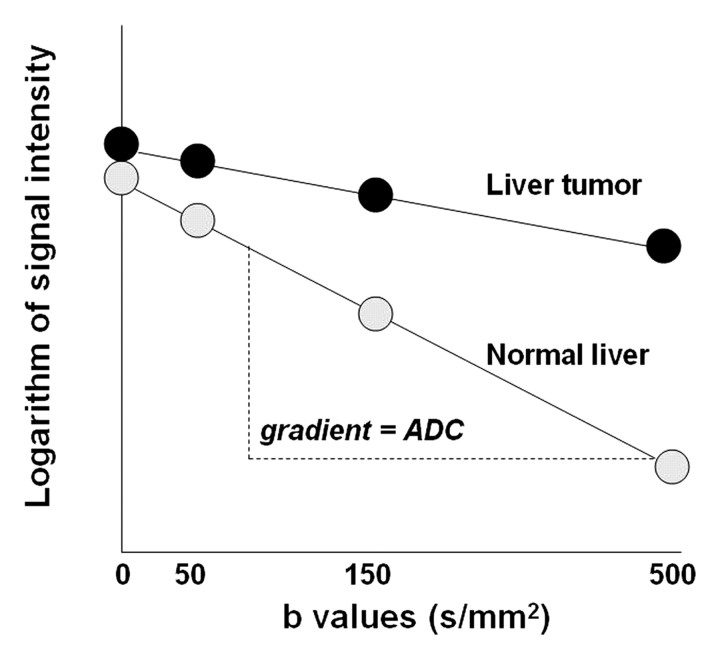
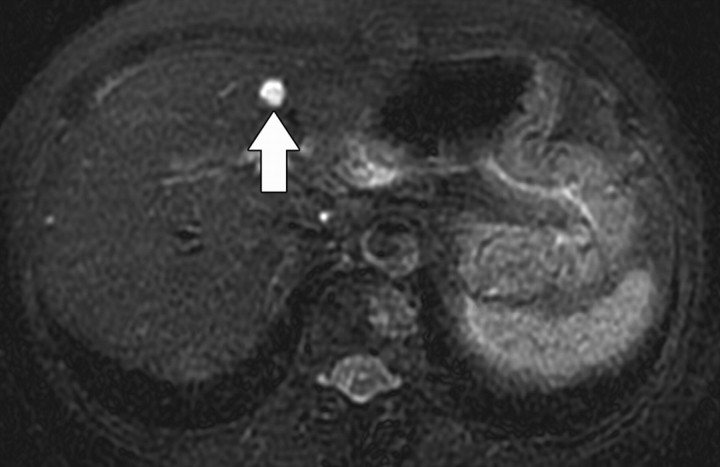
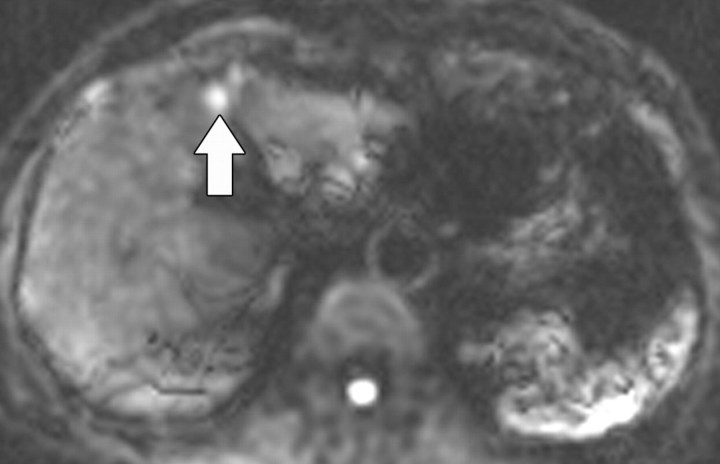
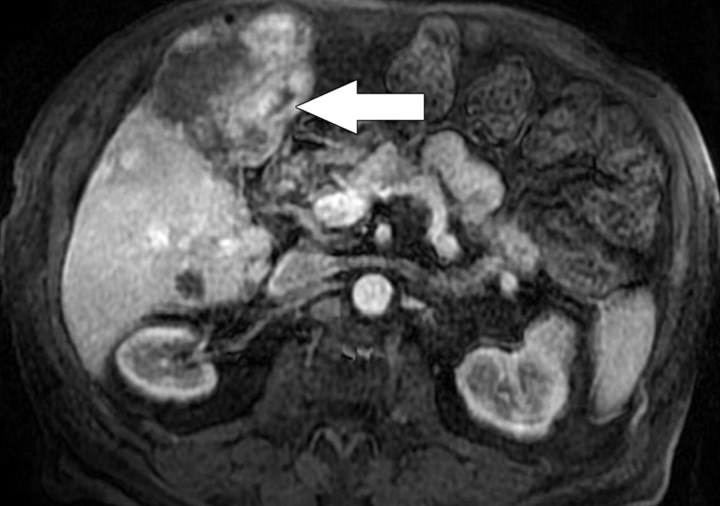
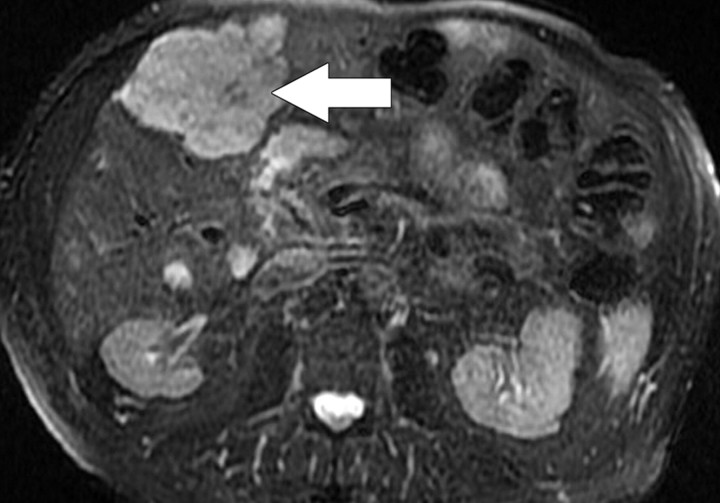
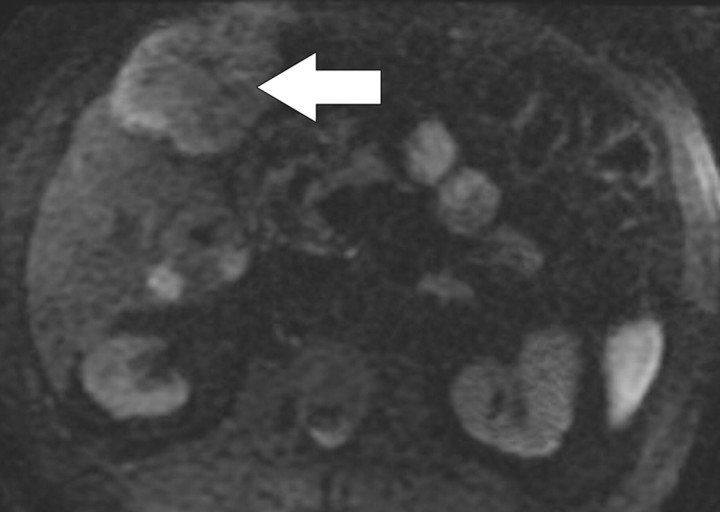
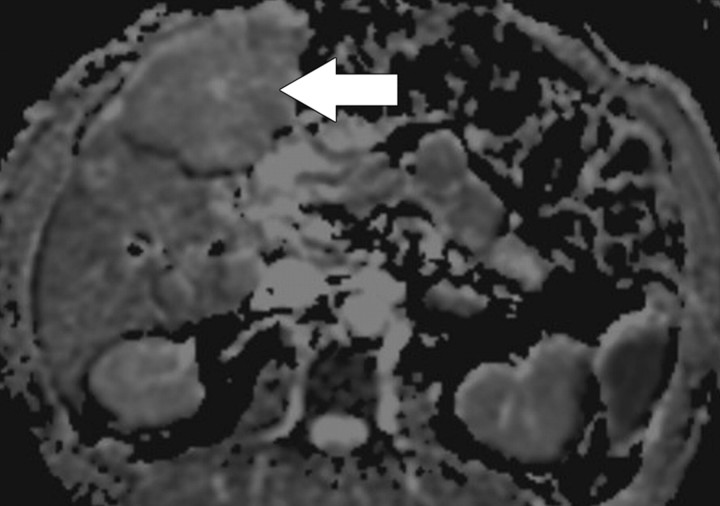
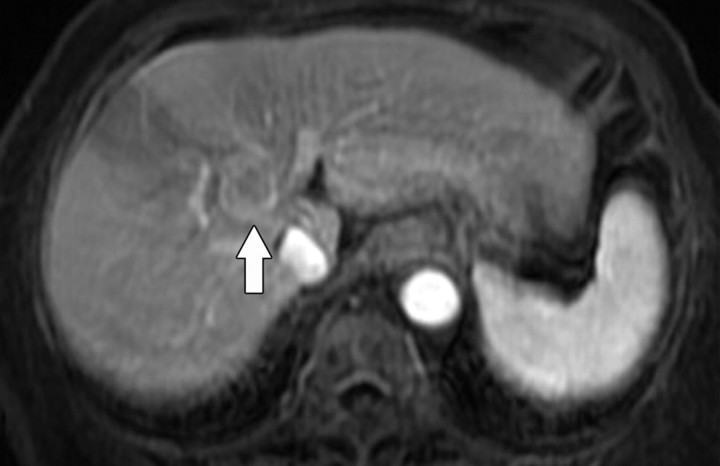
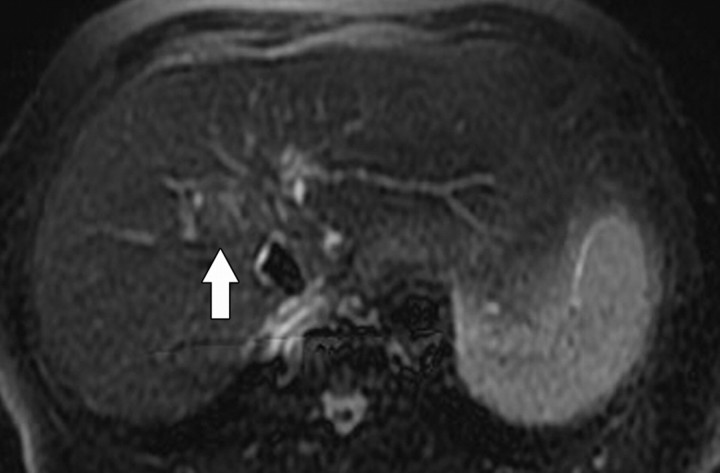
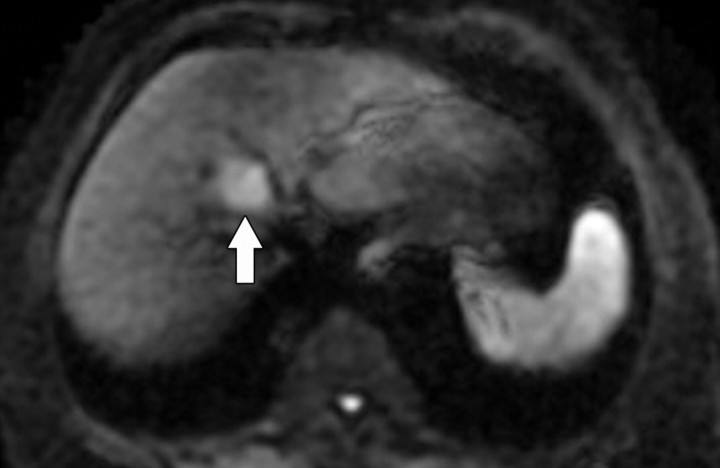
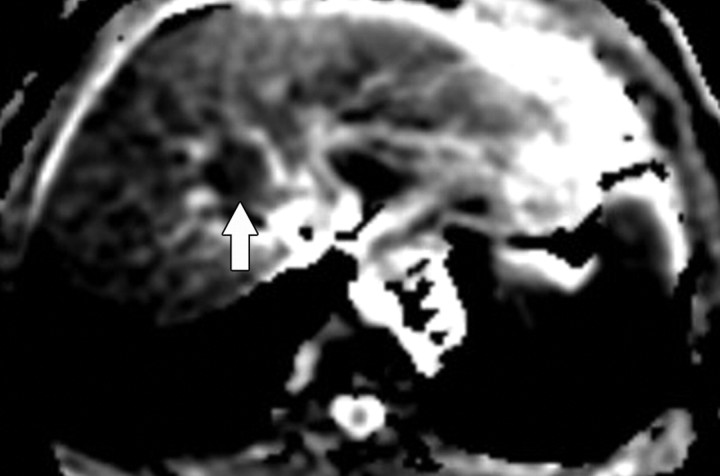
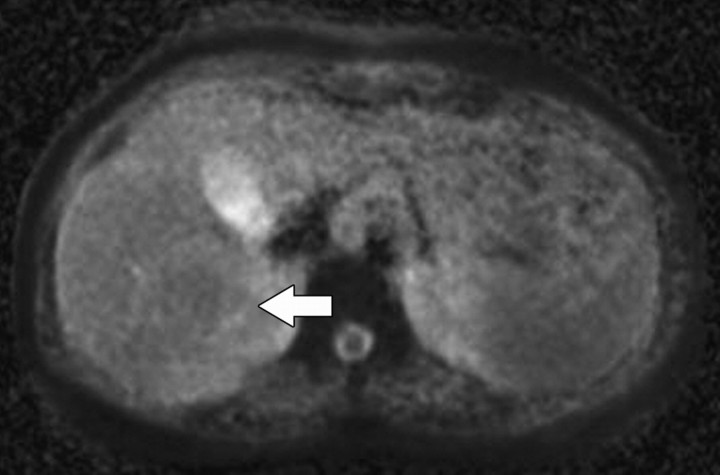
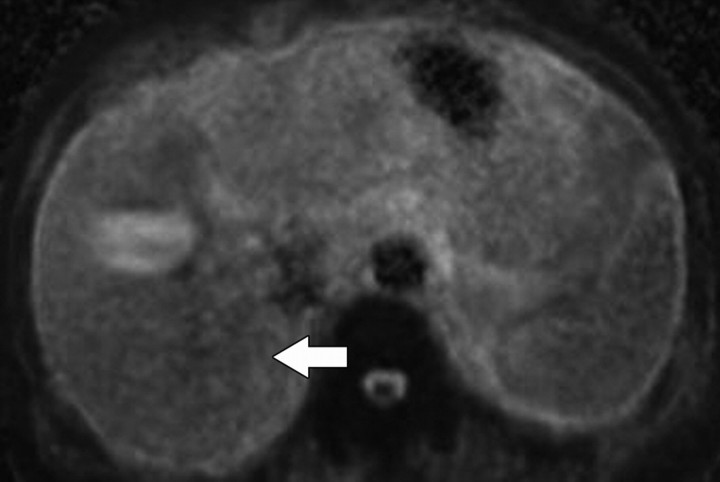
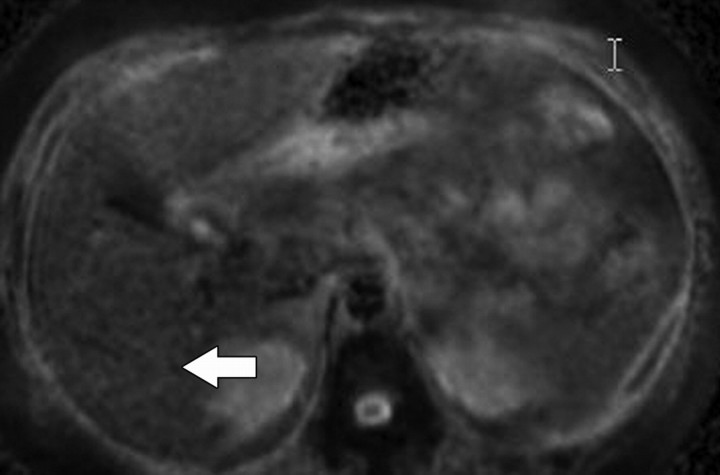
Diffusion-weighted magnetic resonance (MR) imaging allows the detection of focal solid and cystic lesions in the abdomen and pelvis and, if pitfalls are to be avoided, is most effectively used in conjunction with other imaging sequences. It is important to recognize that the strength of the diffusion sensitizing gradient (b value) can and should be adjusted to ensure optimal evaluation of the body region or organ being imaged, and that more than one b value is necessary for tissue characterization. The success of lesion detection and characterization largely depends on the extent of tissue cellularity because increased cellularity is associated with impeded diffusion, as indicated by a reduction in the apparent diffusion coefficient. It is also important to recognize that certain normal tissues such as the endometrium are highly cellular and as such demonstrate restricted diffusion, which should not be misinterpreted as disease. Impeded diffusion can also be seen in highly viscous cystic lesions such as abscesses. Diffusion-weighted imaging is an evolving technology with the potential to improve tissue characterization when findings are interpreted in conjunction with findings obtained with other conventional MR imaging sequences.


Figures

Figure 1
Figure 1
Schematic illustrates water molecule movement. In A, water molecules in a container alone move randomly (Brownian motion). In B, highly cellular tissue impedes the movement of water molecules. Their movement can be categorized as intravascular, intracellular, or extracellular. In C, tissue of low cellularity or with defective cells permits greater water molecule movement.
Figure 10a
Figure 10a
Prostate cancer in a 64-year-old man. (a) On an axial T2-weighted MR image obtained with an endorectal coil, the peripheral zone of the prostate gland appears normal (ie, has high signal intensity), but a questionable focus of hypointensity is seen in the anterior left central portion of the gland (arrow). (b) Axial ADC map more clearly depicts the questionable area as a hypointense focal region of restricted diffusion (arrow).
Figure 10b
Figure 10b
Prostate cancer in a 64-year-old man. (a) On an axial T2-weighted MR image obtained with an endorectal coil, the peripheral zone of the prostate gland appears normal (ie, has high signal intensity), but a questionable focus of hypointensity is seen in the anterior left central portion of the gland (arrow). (b) Axial ADC map more clearly depicts the questionable area as a hypointense focal region of restricted diffusion (arrow).
Figure 11a
Figure 11a
Renal cell carcinoma in a 54-year-old woman. (a) Fast spin-echo T2-weighted MR image shows a mass (arrow) that arises from the left kidney. The mass demonstrates intermediate signal intensity, a finding that is consistent with a solid mass or hemorrhagic cyst. (b) Axial diffusion-weighted image (b = 500 sec/mm2) shows the mass with high signal intensity (arrow). (c) On an axial ADC map, the mass (arrow) demonstrates low signal intensity (restricted diffusion), a finding that is consistent with a solid tumor.
Figure 11b
Figure 11b
Renal cell carcinoma in a 54-year-old woman. (a) Fast spin-echo T2-weighted MR image shows a mass (arrow) that arises from the left kidney. The mass demonstrates intermediate signal intensity, a finding that is consistent with a solid mass or hemorrhagic cyst. (b) Axial diffusion-weighted image (b = 500 sec/mm2) shows the mass with high signal intensity (arrow). (c) On an axial ADC map, the mass (arrow) demonstrates low signal intensity (restricted diffusion), a finding that is consistent with a solid tumor.
Figure 11c
Figure 11c
Renal cell carcinoma in a 54-year-old woman. (a) Fast spin-echo T2-weighted MR image shows a mass (arrow) that arises from the left kidney. The mass demonstrates intermediate signal intensity, a finding that is consistent with a solid mass or hemorrhagic cyst. (b) Axial diffusion-weighted image (b = 500 sec/mm2) shows the mass with high signal intensity (arrow). (c) On an axial ADC map, the mass (arrow) demonstrates low signal intensity (restricted diffusion), a finding that is consistent with a solid tumor.
Figure 2a
Figure 2a
(a) Schematic illustrates the effect of a diffusion-weighted sequence on water molecules (solid circles) within highly cellular tissue or a restricted environment. The diffusion-weighted sequence is fundamentally a T2-weighted sequence with the application of a dephasing gradient (diffusion sensitizing gradient) prior to the 180° RF pulse, followed by a symmetric rephasing gradient after the 180° pulse. Water molecules within a restricted environment do not move long distances and acquire phase shifts during the application of the first gradient that are cancelled out by phase shifts acquired during the second (opposing) gradient. As a result, no net loss in signal intensity occurs (aside from normal T2 decay). (b) Schematic illustrates the effect of a diffusion-weighted sequence on water molecules (solid circles) within tissue with low cellularity or a less restricted environment. Water molecules within a less restricted environment can move long distances. Such highly mobile molecules acquire phase information from the first gradient, but because of their motion, their signal does not completely rephase with the second gradient, resulting in a net loss in signal intensity in addition to normal T2 decay. SE = spin-echo.
Figure 2b
Figure 2b
(a) Schematic illustrates the effect of a diffusion-weighted sequence on water molecules (solid circles) within highly cellular tissue or a restricted environment. The diffusion-weighted sequence is fundamentally a T2-weighted sequence with the application of a dephasing gradient (diffusion sensitizing gradient) prior to the 180° RF pulse, followed by a symmetric rephasing gradient after the 180° pulse. Water molecules within a restricted environment do not move long distances and acquire phase shifts during the application of the first gradient that are cancelled out by phase shifts acquired during the second (opposing) gradient. As a result, no net loss in signal intensity occurs (aside from normal T2 decay). (b) Schematic illustrates the effect of a diffusion-weighted sequence on water molecules (solid circles) within tissue with low cellularity or a less restricted environment. Water molecules within a less restricted environment can move long distances. Such highly mobile molecules acquire phase information from the first gradient, but because of their motion, their signal does not completely rephase with the second gradient, resulting in a net loss in signal intensity in addition to normal T2 decay. SE = spin-echo.
Figure 3
Figure 3
Axial diffusion-weighted image (b = 0 sec/mm2) obtained in a 60-year-old woman shows a signal void within the inferior vena cava (arrow). Small b values will result in decreased signal of highly mobile water molecules such as occur within vessels. Such images are referred to as black-blood images due to the decreased signal of the fast-flowing blood within vessels.
Figure 4
Figure 4
Sagittal diffusion-weighted image (b = 800 sec/mm2) obtained in a 38-year-old woman shows the endometrium with normal high signal intensity (arrow).
Figure 5a
Figure 5a
(a) Graph illustrates signal intensity versus b values at diffusion-weighted imaging (DWI) of tissue with normal versus restricted diffusion. (b) Graph illustrates the logarithm of signal intensity versus b values at diffusion-weighted imaging of normal liver versus liver tumor. The signal of water molecules decays exponentially with increasing b values for different tissue types. The decay in signal is reduced in tissues with restricted diffusion (eg, tumor). The ADC represents the slope (gradient) of the plotted lines. The greater the number of b values used in the analysis, the more accurate the ADC calculation.
Figure 5b
Figure 5b
(a) Graph illustrates signal intensity versus b values at diffusion-weighted imaging (DWI) of tissue with normal versus restricted diffusion. (b) Graph illustrates the logarithm of signal intensity versus b values at diffusion-weighted imaging of normal liver versus liver tumor. The signal of water molecules decays exponentially with increasing b values for different tissue types. The decay in signal is reduced in tissues with restricted diffusion (eg, tumor). The ADC represents the slope (gradient) of the plotted lines. The greater the number of b values used in the analysis, the more accurate the ADC calculation.
Figure 6a
Figure 6a
T2 shine-through in a 42-year-old woman with a small cyst in the left hepatic lobe. (a) T2-weighted image shows a cyst (arrow) with very high signal intensity despite its small size. (b) On a diffusion-weighted image (b = 500 sec/mm2), the cyst (arrow) reflects T2 shine-through rather than restricted diffusion.
Figure 6b
Figure 6b
T2 shine-through in a 42-year-old woman with a small cyst in the left hepatic lobe. (a) T2-weighted image shows a cyst (arrow) with very high signal intensity despite its small size. (b) On a diffusion-weighted image (b = 500 sec/mm2), the cyst (arrow) reflects T2 shine-through rather than restricted diffusion.
Figure 7a
Figure 7a
Hemangioma. (a) Gadolinium-enhanced gradient-echo T1-weighted MR image shows a hemangioma with peripheral nodular enhancement (arrow). (b) On a fast spin-echo T2-weighted MR image, the hemangioma (arrow) is lobulated and demonstrates very high signal intensity. (c) On a diffusion-weighted image (b = 500 sec/mm2), the hemangioma (arrow) demonstrates high signal intensity due to slow-flowing blood. (d) ADC map shows the diffusion of the hemangioma (arrow) to be similar to that of background liver (ie, unimpeded).
Figure 7b
Figure 7b
Hemangioma. (a) Gadolinium-enhanced gradient-echo T1-weighted MR image shows a hemangioma with peripheral nodular enhancement (arrow). (b) On a fast spin-echo T2-weighted MR image, the hemangioma (arrow) is lobulated and demonstrates very high signal intensity. (c) On a diffusion-weighted image (b = 500 sec/mm2), the hemangioma (arrow) demonstrates high signal intensity due to slow-flowing blood. (d) ADC map shows the diffusion of the hemangioma (arrow) to be similar to that of background liver (ie, unimpeded).
Figure 7c
Figure 7c
Hemangioma. (a) Gadolinium-enhanced gradient-echo T1-weighted MR image shows a hemangioma with peripheral nodular enhancement (arrow). (b) On a fast spin-echo T2-weighted MR image, the hemangioma (arrow) is lobulated and demonstrates very high signal intensity. (c) On a diffusion-weighted image (b = 500 sec/mm2), the hemangioma (arrow) demonstrates high signal intensity due to slow-flowing blood. (d) ADC map shows the diffusion of the hemangioma (arrow) to be similar to that of background liver (ie, unimpeded).
Figure 7d
Figure 7d
Hemangioma. (a) Gadolinium-enhanced gradient-echo T1-weighted MR image shows a hemangioma with peripheral nodular enhancement (arrow). (b) On a fast spin-echo T2-weighted MR image, the hemangioma (arrow) is lobulated and demonstrates very high signal intensity. (c) On a diffusion-weighted image (b = 500 sec/mm2), the hemangioma (arrow) demonstrates high signal intensity due to slow-flowing blood. (d) ADC map shows the diffusion of the hemangioma (arrow) to be similar to that of background liver (ie, unimpeded).
Figure 8a
Figure 8a
Hepatocellular carcinoma in an 81-year-old woman. (a) Gadolinium-enhanced T1-weighted MR image shows a hypervascular mass (arrow). (b) On a fat-suppressed fast spin-echo T2-weighted MR image, the mass is slightly hyperintense (arrow). (c) Diffusion-weighted image (b = 500 sec/mm2) shows the mass with high signal intensity (arrow). (d) On an ADC map, the mass demonstrates restricted diffusion (arrow).
Figure 8b
Figure 8b
Hepatocellular carcinoma in an 81-year-old woman. (a) Gadolinium-enhanced T1-weighted MR image shows a hypervascular mass (arrow). (b) On a fat-suppressed fast spin-echo T2-weighted MR image, the mass is slightly hyperintense (arrow). (c) Diffusion-weighted image (b = 500 sec/mm2) shows the mass with high signal intensity (arrow). (d) On an ADC map, the mass demonstrates restricted diffusion (arrow).
Figure 8c
Figure 8c
Hepatocellular carcinoma in an 81-year-old woman. (a) Gadolinium-enhanced T1-weighted MR image shows a hypervascular mass (arrow). (b) On a fat-suppressed fast spin-echo T2-weighted MR image, the mass is slightly hyperintense (arrow). (c) Diffusion-weighted image (b = 500 sec/mm2) shows the mass with high signal intensity (arrow). (d) On an ADC map, the mass demonstrates restricted diffusion (arrow).
Figure 8d
Figure 8d
Hepatocellular carcinoma in an 81-year-old woman. (a) Gadolinium-enhanced T1-weighted MR image shows a hypervascular mass (arrow). (b) On a fat-suppressed fast spin-echo T2-weighted MR image, the mass is slightly hyperintense (arrow). (c) Diffusion-weighted image (b = 500 sec/mm2) shows the mass with high signal intensity (arrow). (d) On an ADC map, the mass demonstrates restricted diffusion (arrow).
Figure 9a
Figure 9a
Diffuse liver disease. (a) ADC map obtained in a 36-year-old woman with grade 0 steatosis and stage 0 fibrosis shows no pathologic findings. Arrow indicates the right hepatic lobe. (b, c) ADC maps obtained in a 56-year-old man with nonalcoholic fatty liver disease, grade 1 steatosis, and stage 0 fibrosis (b) and in a 50- year-old woman with nonalcoholic fatty liver disease, grade 1 steatosis, and stage 1 fibrosis (c) show restricted diffusion in the right hepatic lobe (arrow). Regions of interest placed in the right hepatic lobe may be used to measure ADC. ADC measurements of the left lateral segment are typically degraded by cardiac motion.
Figure 9b
Figure 9b
Diffuse liver disease. (a) ADC map obtained in a 36-year-old woman with grade 0 steatosis and stage 0 fibrosis shows no pathologic findings. Arrow indicates the right hepatic lobe. (b, c) ADC maps obtained in a 56-year-old man with nonalcoholic fatty liver disease, grade 1 steatosis, and stage 0 fibrosis (b) and in a 50- year-old woman with nonalcoholic fatty liver disease, grade 1 steatosis, and stage 1 fibrosis (c) show restricted diffusion in the right hepatic lobe (arrow). Regions of interest placed in the right hepatic lobe may be used to measure ADC. ADC measurements of the left lateral segment are typically degraded by cardiac motion.
Figure 9c
Figure 9c
Diffuse liver disease. (a) ADC map obtained in a 36-year-old woman with grade 0 steatosis and stage 0 fibrosis shows no pathologic findings. Arrow indicates the right hepatic lobe. (b, c) ADC maps obtained in a 56-year-old man with nonalcoholic fatty liver disease, grade 1 steatosis, and stage 0 fibrosis (b) and in a 50- year-old woman with nonalcoholic fatty liver disease, grade 1 steatosis, and stage 1 fibrosis (c) show restricted diffusion in the right hepatic lobe (arrow). Regions of interest placed in the right hepatic lobe may be used to measure ADC. ADC measurements of the left lateral segment are typically degraded by cardiac motion.

Similar articles

Cited by

References

    1. Koh DM, Collins DJ. Diffusion-weighted MRI in the body: applications and challenges in oncology. AJR Am J Roentgenol 2007;188(6):1622–1635. - PubMed
    1. Stejskal EO, Tanner JE. Spin diffusion measurements: spin-echo in the presence of a time dependent field gradient. J Chem Phys 1965;42:288–292.
    1. Patterson DM, Padhani AR, Collins DJ. Technology insight: water diffusion MRI—a potential new biomarker of response to cancer therapy. Nat Clin Pract Oncol 2008;5(4):220–233. - PubMed
    1. Neil JJ. Measurement of water motion (apparent diffusion) in biological systems. Concepts Magn Reson 1997;9:385–401.
    1. Pagani E, Bizzi A, Di Salle F, De Stefano N, Filippi M. Basic concepts of advanced MRI techniques. Neurol Sci 2008;29(suppl 3):290–295. - PubMed

LinkOut - more resources