

Estimated epidemiologic parameters and morbidity associated with pandemic H1N1 influenza
- PMID: 19959592
- PMCID: PMC2817319
- DOI: 10.1503/cmaj.091807
Estimated epidemiologic parameters and morbidity associated with pandemic H1N1 influenza
Abstract
Background: In the face of an influenza pandemic, accurate estimates of epidemiologic parameters are required to help guide decision-making. We sought to estimate epidemiologic parameters for pandemic H1N1 influenza using data from initial reports of laboratory-confirmed cases.
Methods: We obtained data on laboratory-confirmed cases of pandemic H1N1 influenza reported in the province of Ontario, Canada, with dates of symptom onset between Apr. 13 and June 20, 2009. Incubation periods and duration of symptoms were estimated and fit to parametric distributions. We used competing-risk models to estimate risk of hospital admission and case-fatality rates. We used a Markov Chain Monte Carlo model to simulate disease transmission.
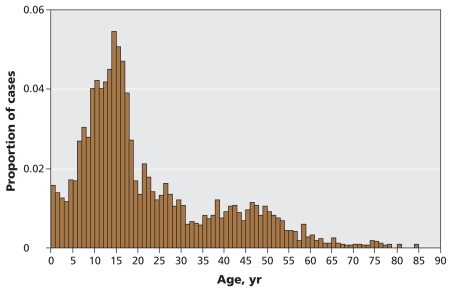
Results: The median incubation period was 4 days and the duration of symptoms was 7 days. Recovery was faster among patients less than 18 years old than among older patients (hazard ratio 1.23, 95% confidence interval 1.06-1.44). The risk of hospital admission was 4.5% (95% CI 3.8%-5.2%) and the case-fatality rate was 0.3% (95% CI 0.1%-0.5%). The risk of hospital admission was highest among patients less than 1 year old and those 65 years or older. Adults more than 50 years old comprised 7% of cases but accounted for 7 of 10 initial deaths (odds ratio 28.6, 95% confidence interval 7.3-111.2). From the simulation models, we estimated the following values (and 95% credible intervals): a mean basic reproductive number (R0, the number of new cases created by a single primary case in a susceptible population) of 1.31 (1.25-1.38), a mean latent period of 2.62 (2.28-3.12) days and a mean duration of infectiousness of 3.38 (2.06-4.69) days. From these values we estimated a serial interval (the average time from onset of infectiousness in a case to the onset of infectiousness in a person infected by that case) of 4-5 days.
Interpretation: The low estimates for R0 indicate that effective mitigation strategies may reduce the final epidemic impact of pandemic H1N1 influenza.
Figures


Comment in
-
The H1N1 birthday cake: To blow or not to blow.CMAJ. 2010 Mar 9;182(4):384. doi: 10.1503/cmaj.110-2032. CMAJ. 2010. PMID: 20212056 Free PMC article. No abstract available.
-
Seasonality and H1N1.CMAJ. 2010 Apr 6;182(6):593. doi: 10.1503/cmaj.110-2039. CMAJ. 2010. PMID: 20368300 Free PMC article. No abstract available.
References
-
- Farley TM, Ali MM, Slaymaker E. Competing approaches to analysis of failure times with competing risks. Stat Med. 2001;20:3601–10. - PubMed
Publication types
MeSH terms
Grants and funding
LinkOut - more resources
Full Text Sources
Other Literature Sources
Medical
Miscellaneous