. 2009 Dec 22;106(51):21924-9.
doi: 10.1073/pnas.0909894106. Epub 2009 Dec 3.

Forced G1-phase reduction alters mode of division, neuron number, and laminar phenotype in the cerebral cortex

Affiliations

Forced G1-phase reduction alters mode of division, neuron number, and laminar phenotype in the cerebral cortex

Louis-Jan Pilaz et al. Proc Natl Acad Sci U S A. .

Abstract

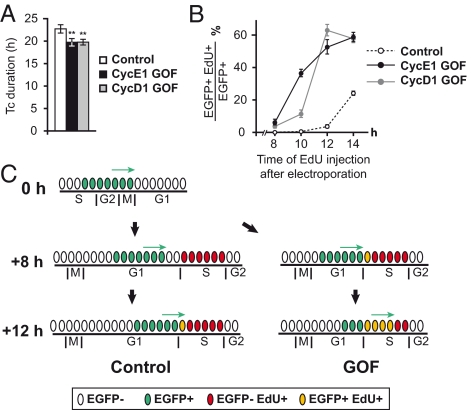
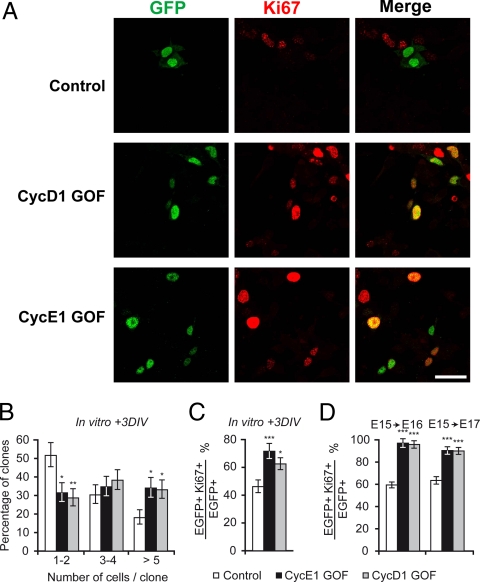
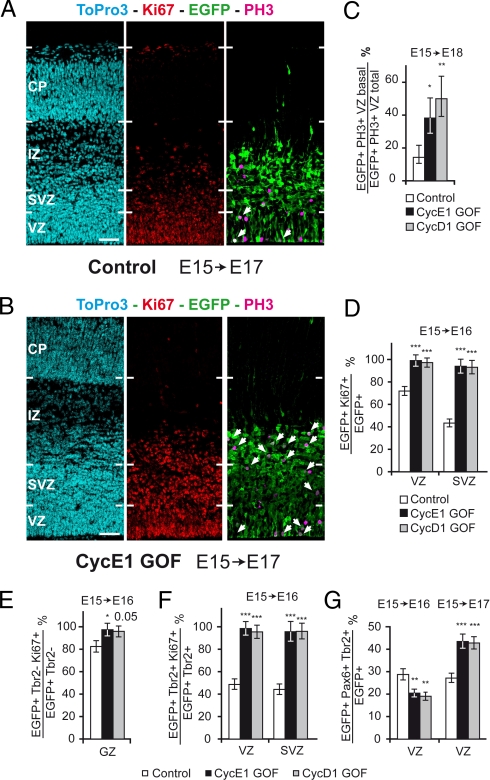
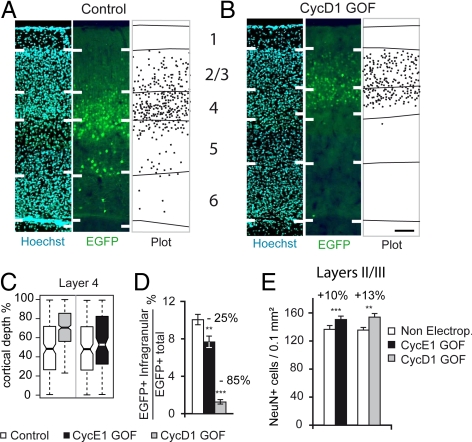
The link between cortical precursors G1 duration (TG1) and their mode of division remains a major unresolved issue of potential importance for regulating corticogenesis. Here, we induced a 25% reduction in TG1 in mouse cortical precursors via forced expression of cyclin D1 and cyclin E1. We found that in utero electroporation-mediated gene transfer transfects a cohort of synchronously cycling precursors, necessitating alternative methods of measuring cell-cycle phases to those classical used. TG1 reduction promotes cell-cycle reentry at the expense of differentiation and increases the self-renewal capacities of Pax6 precursors as well as of Tbr2 basal precursors (BPs). A population level analysis reveals sequential and lineage-specific effects, showing that TG1 reduction: (i) promotes Pax6 self-renewing proliferative divisions before promoting divisions wherein Pax6 precursors generate Tbr2 BPs and (ii) promotes self-renewing proliferative divisions of Tbr2 precursors at the expense of neurogenesis, thus leading to an amplification of the BPs pool in the subventricular zone and the dispersed mitotic compartment of the intermediate zone. These results point to the G1 mode of division relationship as an essential control mechanism of corticogenesis. This is further supported by long-term studies showing that TG1 reduction results in cytoarchitectural modifications including supernumerary supragranular neuron production. Modeling confirms that the TG1-induced changes in neuron production and laminar fate are mediated via the changes in the mode of division. These findings also have implications for understanding the mechanisms that have contributed to brain enlargement and complexity during evolution.


Conflict of interest statement

The authors declare no conflict of interest.

Figures

Fig. 1.
Fig. 1.
Overexpression of cyclin E1 and cyclin D1 influence cell-cycle characteristics of cortical precursors. (A) Cell-cycle duration (Tc) of control and GOF precursors measured by time-lapse videorecording, on E14.5 organotypic slices, 24 h after electroporation. Overexpression of cyclin E1 and cyclin D1 leads to a significant shortening of Tc (22.8 h in control; range: 15–28 h, n = 16) vs. 19.75 h in GOF precursors (GOF cyclin E1: range: 13–23 h, n = 13; GOF cyclin D1: range: 13–22 h, n = 25). Unpaired t test: cyclin E1 GOF: P = 0.0024; cyclin D1 GOF: P = 0.0075. (B) TG1 in GOF and control transfected precursors. A small proportion of EdU+/EGFP+ cells are detected in both GOF conditions, 8 h after electroporation, whereas the first EDU+/EGFP+ precursors (3.3%) are detected only 12 h after electoporation in control precursors. (C) Diagram: Electroporation transfects a cohort of cells in late S, G2/M phases (cells in green). The EGFP+ cohort progresses through G1 phase at different rates between control and GOF conditions. Only GOF precursors have reached S phase 8 h after electroporation.
Fig. 2.
Fig. 2.
Proliferative status of overexpressing cyclin E1 and cyclin D1 precursors. (A) Microphotographs showing clone size and Ki67 expression in dissociated cortical precursors, 3 days after in vitro lipofection at E15. (Scale bars, 40 μm.) (B) Clones sizes in control and GOF precursors: dissociated cultures, 3 days after in vitro lipofection at E15. GLM analysis: clones 1–2 cyclin E1 GOF: P = 0.015; clone 1–2 cyclin D1 GOF: P = 0.0039; clone >5 cyclin E1 GOF: P = 0.017; clone >5 cyclin D1 GOF: P = 0.020. (C) Percentage of cycling cells in control and GOF transfected populations and their progeny in dissociated cultures, as shown by Ki67 expression. GLM analysis: cyclin E1 GOF: P = 0.00042; cyclin D1 GOF: P = 0.011. (D) Percentage of cycling cells in the transfected populations and their progeny, as shown by Ki67 expression. Measurements were made in the GZ in vivo. GLM analysis: E15–E16: cyclin E1 GOF: P < 0.001; E15–E16: cyclin D1 GOF: P < 0.001; E15–E17: cyclin E1 GOF: P < 0.001; E15–E17: cyclin D1 GOF: P < 0.001.
Fig. 3.
Fig. 3.
Consequence of GOF on precursor pools. (A and B) Confocal microphotographs of coronal sections showing Ki67 and PH3 expressing cells in the electoporated regions of E17 brains, after electroporation at E15. Arrows indicate EGFP+ PH3+ mitotic cells. (Scale bars, 50 μm.) High power views of Z projections to show colocalisation of PH3 and EGFP are shown in Fig. S5 B–D. (C) Higher proportions of basal mitosis figures in the VZ in GOF conditions than in control conditions. GLM analysis: cyclin E1 GOF: P = 0.027; E15–E18 cyclin D1 GOF: P = 0.0092. (D) Percentage of cycling cells in the transfected populations and their progeny, as shown by Ki67 expression, in vivo. GLM analysis: VZ cyclin E1 GOF: P < 0.001; VZ cyclin D1 GOF: P < 0.001; SVZ cyclin E1 GOF: P < 0.001; SVZ cyclin D1 GOF: P < 0.001. (E) Percentage of Tbr2- cycling cells in the transfected populations and their progeny, as shown by Ki67 expression, in vivo. GLM analysis: GZ cyclin E1 GOF: P = 0.049; GZ cyclin D1 GOF: P = 0.054. (F) Percentage of Tbr2+ cycling cells in the Tbr2+ transfected populations and their progeny, as shown by Ki67 expression in vivo. GLM analysis: VZ cyclin E1 GOF: P < 0.001; VZ cyclin D1 GOF: P < 0.001; SVZ cyclin E1 GOF: P < 0.001; SVZ cyclin D1 GOF: P < 0.001. (G) Percentage of Tbr2+ Pax6+ cells in the transfected population and their progeny in the VZ. GLM Analysis: E15–E16 cyclin E1 GOF: P = 0.0048; E15–E16 cyclin D1 GOF: P = 0.0013; E15–E17 cyclin E1 GOF: P < 0.001; E15–E17 cyclin D1 GOF: P < 0.001.
Fig. 4.
Fig. 4.
Laminar phenotype of post-mitotic neurons generated by the transfected precursors, 2 weeks after birth, under control and GOF conditions. (A and B) Photomicrographs of a transect of Hoechst and EGFP stained coronal section in area 3 showing the limits of plots of the distribution of EGFP expressing neurons born from control (A) and GOF (B) precursors. (Scale bar, 100 μm.) (C) Box plot analysis of the radial distribution of layer 4 EGFP neurons, born from control and GOF precursors in area 3. Individual box indicates mid 50th percentile range of individual distance neuron measurements. Whiskers, 10th to 90th percentiles; horizontal bold line, mean. (D) EGFP labeled neurons located in the infragranular layers, in control and GOF conditions. GLM analysis: cyclin E1 GOF: P = 0.0054; cyclin D1 GOF: P < 0.001. (E) Variations in neuron density in the supragranular layers of the electroporated region compared to control, at P15. Paired t test: cyclin E1 GOF: P < 0.001; cyclin D1 GOF: P < 0.001.

References

    1. Herculano-Houzel S, Collins CE, Wong P, Kaas JH, Lent R. The basic nonuniformity of the cerebral cortex. Proc Natl Acad Sci USA. 2008;105:12593–12598. - PMC - PubMed
    1. Rockel AJ, Hiorns RW, Powell TP. The basic uniformity in structure of the neocortex. Brain. 1980;103:221–244. - PubMed
    1. Lukaszewicz A, et al. G1 phase regulation, area-specific cell cycle control, and cytoarchitectonics in the primate cortex. Neuron. 2005;47:353–364. - PMC - PubMed
    1. Polleux F, Dehay C, Moraillon B, Kennedy H. Regulation of neuroblast cell-cycle kinetics plays a crucial role in the generation of unique features of neocortical areas. J Neurosci. 1997;17:7763–7783. - PMC - PubMed
    1. Rakic P. A small step for the cell, a giant leap for mankind: A hypothesis of neocortical expansion during evolution. Trends Neurosci. 1995;18:383–388. - PubMed

Publication types