. 2009 Dec 22;106(51):21771-6.
doi: 10.1073/pnas.0909331106. Epub 2009 Dec 3.

Adventitious changes in long-range gene expression caused by polymorphic structural variation and promoter competition

Affiliations

Adventitious changes in long-range gene expression caused by polymorphic structural variation and promoter competition

Karen M Lower et al. Proc Natl Acad Sci U S A. .

Abstract

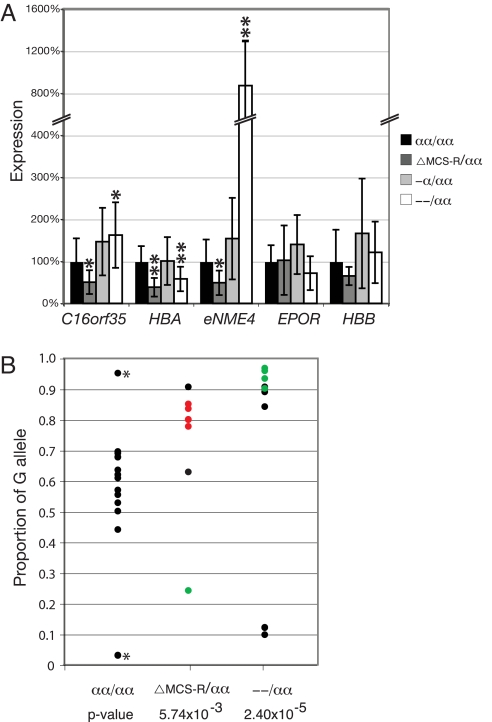
It is well established that all of the cis-acting sequences required for fully regulated human alpha-globin expression are contained within a region of approximately 120 kb of conserved synteny. Here, we show that activation of this cluster in erythroid cells dramatically affects expression of apparently unrelated and noncontiguous genes in the 500 kb surrounding this domain, including a gene (NME4) located 300 kb from the alpha-globin cluster. Changes in NME4 expression are mediated by physical cis-interactions between this gene and the alpha-globin regulatory elements. Polymorphic structural variation within the globin cluster, altering the number of alpha-globin genes, affects the pattern of NME4 expression by altering the competition for the shared alpha-globin regulatory elements. These findings challenge the concept that the genome is organized into discrete, insulated regulatory domains. In addition, this work has important implications for our understanding of genome evolution, the interpretation of genome-wide expression, expression-quantitative trait loci, and copy number variant analyses.


Conflict of interest statement

The authors declare no conflict of interest.

Figures

Fig. 1.
Fig. 1.
Overview and expression analysis of the terminal 500 kb of human chromosome 16p, containing the α-globin cluster. (A) Representation of the genes contained within this chromosomal region. Conserved synteny with the mouse region and the MCS-R region, which is conserved and required for full expression of the α-globin genes are shown. The minimal regions deleted, in all cases of α-thalassemia affecting the MCS-R elements (ΔMCS-R) one (-α) or two (--) α genes, are shown. ChIP for the activating chromatin mark H4ac, the erythroid-specific binding factors GATA1 and SCL, and RNA polymerase II were carried out in erythroid cells and hybridized to a tiled microarray covering this region (ChIP-chip). Tracks are representative of a minimum of two biological replicates. (B) Expression of genes contained within this region, and an erythroid control gene EPOR, in hES and erythroid cells. Expression was normalized to 18S. Values represent an average of three biological replicates ± 1 standard deviation. The y axis is a log scale. (C) Schematic representation of the genomic structure of NME4 and eNME4. (Black boxes) Exons; (gray box) alternative erythroid-specific exon; (full line) introns; (dashed lines) splicing of mature transcript. Amplicons used for expression analysis are shown; further information can be found in Tables S1–S3. The highly polymorphic SNP used for allele-specific expression (rs14293) is shown in red.
Fig. 2.
Fig. 2.
Allele-specific effect on the expression of eNME4 by various deletions of the α-globin cluster. (A) Expression of the three erythroid-specific genes in the terminal 500 kb of chromosome 16p, and two erythroid-specific control genes, EPOR and HBB. For each gene, the expression in control samples is set to 100%, and each group of deletions is calculated relative to controls. Student's t test P values are calculated for each gene for each group of samples compared to controls; *, P < 0.05; **, P < 0.005. Controls, n = 15; ΔMCS-R/αα, n = 7; -α/αα, n = 14; --/αα, n = 22. (B) The proportion of the G allele of NME4 contributing to total transcription, as determined by pyrosequencing (see Tables S4 and S5 for details). All samples are heterozygous (A/G) for SNP rs14293 (controls, n = 12; ΔMCS-R/αα, n = 7; --/αα, n = 11) except for an A/A and a G/G control (indicated by *). Samples for which phase of the α-globin locus deletion and the SNP allele could be determined are shown in color; deletion in phase with the A allele are shown in red; deletion in phase with the G allele are shown in green; samples where phase could not be determined are shown in black. The P value is calculated by an f test for differences in variation.
Fig. 3.
Fig. 3.
4C analysis from MCS-R2 identifies a physical interaction with NME4 in --/αα erythroid material. (A) 4C material hybridized to a tiled microarray. The dashed line represents the fixed fragment of MCS-R2. Shaded boxes show α-globin locus and NME4; nonerythroid, EBV-transformed B-lymphocyte cell line; erythroid, two-phase culture system for generation of erythroid cells. All tracks are representative of two biological replicates. Zoomed section shows signal from Lower. Actual enrichment of 4C-amplified material relative to genomic DNA (based on real-time PCR; QPCR) is shown for two amplicons (389776 and 396875). The y axis is a log scale. Arrows represent transcription of NME4 and eNME4. Primer sequences can be found in Table S6. (B) Pyrosequencing tracks from an --/αα individual informative for SNP rs14293 at NME4. (Upper) Genomic DNA; (Lower) 4C-amplified DNA. Peaks used for calculations are shaded; peak 4 corresponds to the G allele, peak 8 corresponds to the A allele; dispensation order of nucleotides is shown on the x axis; E, enzyme; S, substrate. Further information can be found in Tables S4 and S5.
Fig. 4.
Fig. 4.
Schematic representation of the effect of activated α-globin MCS-Rs, and structural polymorphisms, on the expression of surrounding genes. (A) In erythroid cells the α-globin MCS-Rs (black bars) up-regulate the α globin genes (red boxes), and also C16orf35 (yellow box; mechanism unknown) and NME4 (blue box; via a physical interaction in cis). (B) Variation in the number of α-globin genes (shown in this example as deletion of both adult α-globin genes) results in variation in the expression of NME4 through competition for the shared enhancer element. Boxes represent genes as shown in Fig. 1A; gray boxes are unaffected genes. The light gray area represents the region of conserved synteny across the α-globin locus. Arrowhead lines indicate interactions, thickness of the line represents frequency of the interaction.

References

    1. Kim TH, et al. Analysis of the vertebrate insulator protein CTCF-binding sites in the human genome. Cell. 2007;128:1231–1245. - PMC - PubMed
    1. Kleinjan DA, van Heyningen V. Long-range control of gene expression: Emerging mechanisms and disruption in disease. Am J Hum Genet. 2005;76:8–32. - PMC - PubMed
    1. Dean A. On a chromosome far, far away: LCRs and gene expression. Trends Genet. 2006;22:38–45. - PubMed
    1. Hughes JR, et al. Annotation of cis-regulatory elements by identification, subclassification, and functional assessment of multispecies conserved sequences. Proc Natl Acad Sci USA. 2005;102:9830–9835. - PMC - PubMed
    1. De Gobbi M, et al. Tissue-specific histone modification and transcription factor binding in alpha globin gene expression. Blood. 2007;110:4503–4510. - PubMed

Publication types