

Solution structure of the IIAChitobiose-IIBChitobiose complex of the N,N'-diacetylchitobiose branch of the Escherichia coli phosphotransferase system
- PMID: 19959833
- PMCID: PMC2823556
- DOI: 10.1074/jbc.M109.080937
Solution structure of the IIAChitobiose-IIBChitobiose complex of the N,N'-diacetylchitobiose branch of the Escherichia coli phosphotransferase system
Abstract
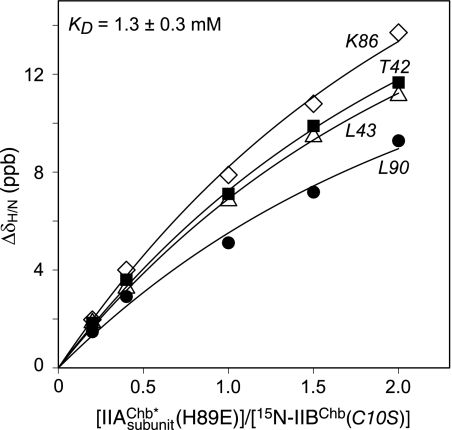
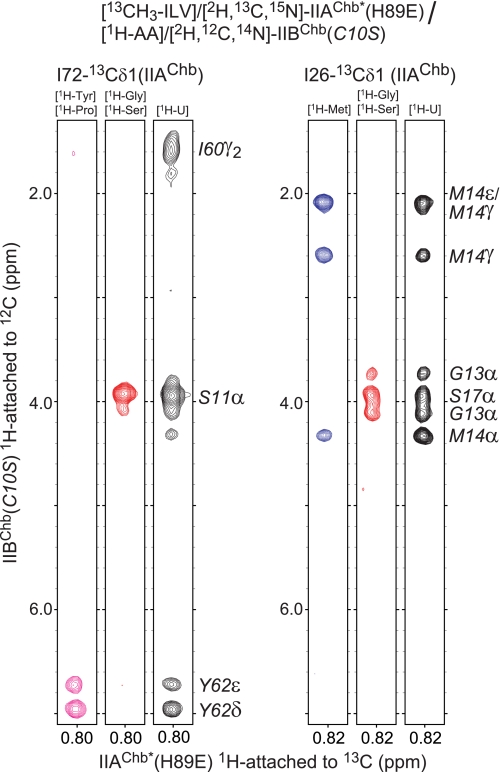
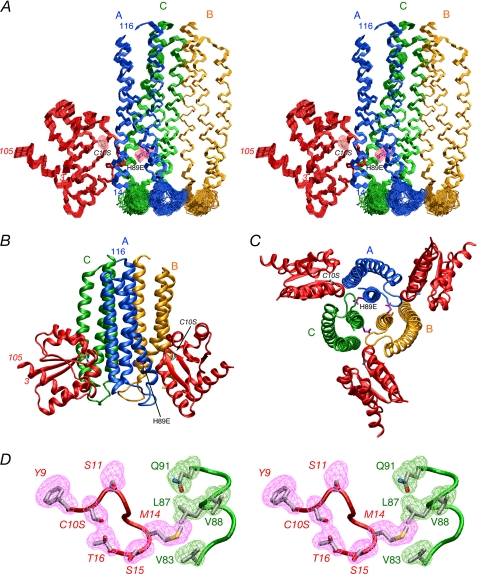
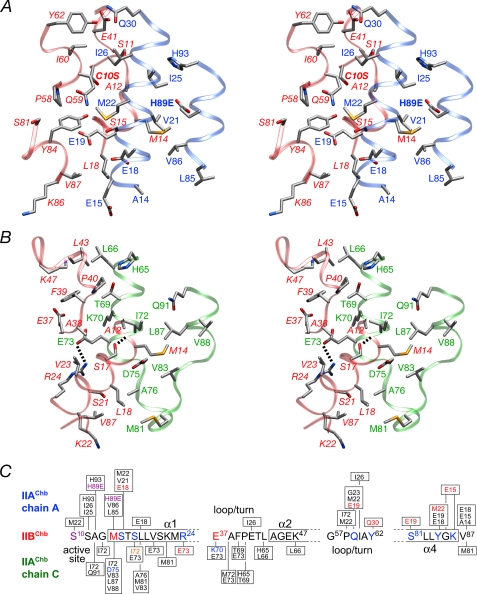
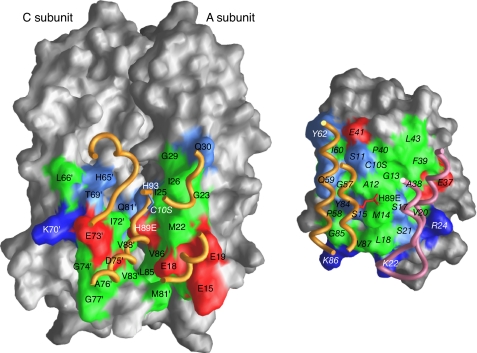
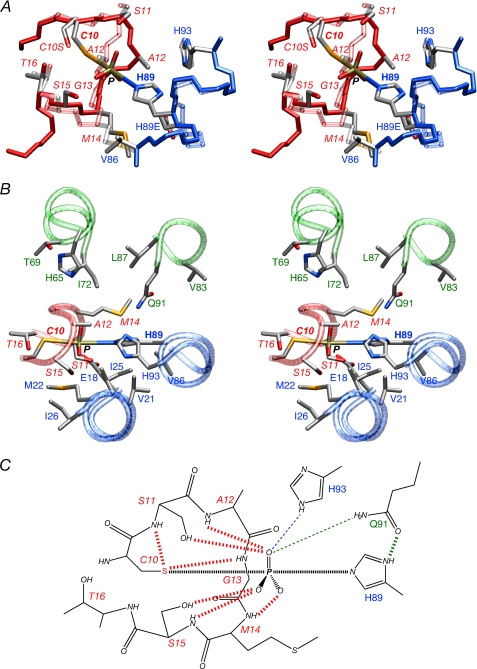
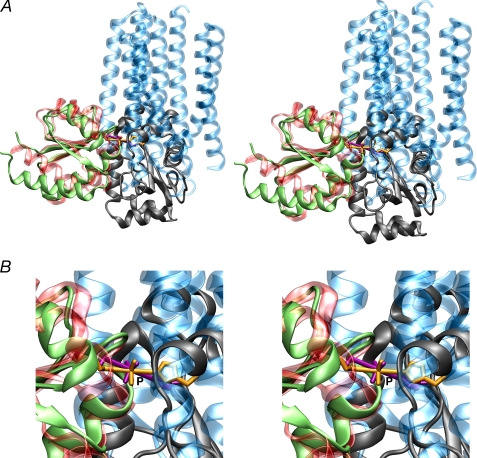
The solution structure of the IIA-IIB complex of the N,N'-diacetylchitobiose (Chb) transporter of the Escherichia coli phosphotransferase system has been solved by NMR. The active site His-89 of IIA(Chb) was mutated to Glu to mimic the phosphorylated state and the active site Cys-10 of IIB(Chb) was substituted by serine to prevent intermolecular disulfide bond formation. Binding is weak with a K(D) of approximately 1.3 mm. The two complementary interaction surfaces are largely hydrophobic, with the protruding active site loop (residues 9-16) of IIB(Chb) buried deep within the active site cleft formed at the interface of two adjacent subunits of the IIA(Chb) trimer. The central hydrophobic portion of the interface is surrounded by a ring of polar and charged residues that provide a relatively small number of electrostatic intermolecular interactions that serve to correctly align the two proteins. The conformation of the active site loop in unphosphorylated IIB(Chb) is inconsistent with the formation of a phosphoryl transition state intermediate because of steric hindrance, especially from the methyl group of Ala-12 of IIB(Chb). Phosphorylation of IIB(Chb) is accompanied by a conformational change within the active site loop such that its path from residues 11-13 follows a mirror-like image relative to that in the unphosphorylated state. This involves a transition of the phi/psi angles of Gly-13 from the right to left alpha-helical region, as well as smaller changes in the backbone torsion angles of Ala-12 and Met-14. The resulting active site conformation is fully compatible with the formation of the His-89-P-Cys-10 phosphoryl transition state without necessitating any change in relative translation or orientation of the two proteins within the complex.
Figures
Similar articles
-
Solution structure of the IIAChitobiose-HPr complex of the N,N'-diacetylchitobiose branch of the Escherichia coli phosphotransferase system.J Biol Chem. 2012 Jul 6;287(28):23819-29. doi: 10.1074/jbc.M112.371492. Epub 2012 May 16. J Biol Chem. 2012. PMID: 22593574 Free PMC article.
-
Three-dimensional solution structure of the cytoplasmic B domain of the mannitol transporter IImannitol of the Escherichia coli phosphotransferase system.J Biol Chem. 2004 Sep 10;279(37):39115-21. doi: 10.1074/jbc.M406764200. Epub 2004 Jul 15. J Biol Chem. 2004. PMID: 15258141
-
NMR structure of cysteinyl-phosphorylated enzyme IIB of the N,N'-diacetylchitobiose-specific phosphoenolpyruvate-dependent phosphotransferase system of Escherichia coli.J Mol Biol. 2001 May 18;308(5):993-1009. doi: 10.1006/jmbi.2001.4623. J Mol Biol. 2001. PMID: 11352587
-
Solution structure of a post-transition state analog of the phosphotransfer reaction between the A and B cytoplasmic domains of the mannitol transporter IIMannitol of the Escherichia coli phosphotransferase system.J Biol Chem. 2006 Mar 31;281(13):8939-49. doi: 10.1074/jbc.M513466200. Epub 2006 Jan 28. J Biol Chem. 2006. PMID: 16443929
-
Three-dimensional structures of protein-protein complexes in the E. coli PTS.J Mol Microbiol Biotechnol. 2001 Jul;3(3):347-54. J Mol Microbiol Biotechnol. 2001. PMID: 11361064 Review.
Cited by
-
Biophysical characterization of the domain association between cytosolic A and B domains of the mannitol transporter enzymes II(Mtl) in the presence and absence of a connecting linker.Protein Sci. 2016 Oct;25(10):1803-11. doi: 10.1002/pro.2988. Epub 2016 Aug 1. Protein Sci. 2016. PMID: 27438678 Free PMC article.
-
Domain cooperativity in multidomain proteins: what can we learn from molecular alignment in anisotropic media?J Biomol NMR. 2011 Sep;51(1-2):131-50. doi: 10.1007/s10858-011-9548-7. Epub 2011 Sep 27. J Biomol NMR. 2011. PMID: 21947922 Free PMC article.
-
Structural insight into the PTS sugar transporter EIIC.Biochim Biophys Acta. 2015 Mar;1850(3):577-85. doi: 10.1016/j.bbagen.2014.03.013. Epub 2014 Mar 20. Biochim Biophys Acta. 2015. PMID: 24657490 Free PMC article. Review.
-
Solution structure of the IIAChitobiose-HPr complex of the N,N'-diacetylchitobiose branch of the Escherichia coli phosphotransferase system.J Biol Chem. 2012 Jul 6;287(28):23819-29. doi: 10.1074/jbc.M112.371492. Epub 2012 May 16. J Biol Chem. 2012. PMID: 22593574 Free PMC article.
-
Solution structure of a complex of the histidine autokinase CheA with its substrate CheY.Biochemistry. 2012 May 8;51(18):3786-98. doi: 10.1021/bi300147m. Epub 2012 Apr 26. Biochemistry. 2012. PMID: 22494339 Free PMC article.
References
Publication types
MeSH terms
Substances
Associated data
- Actions
Grants and funding
LinkOut - more resources
Full Text Sources
Molecular Biology Databases
Miscellaneous
