. 2010 May 1;126(9):2012-24.
doi: 10.1002/ijc.25074.

The polyamine metabolism genes ornithine decarboxylase and antizyme 2 predict aggressive behavior in neuroblastomas with and without MYCN amplification

Affiliations

The polyamine metabolism genes ornithine decarboxylase and antizyme 2 predict aggressive behavior in neuroblastomas with and without MYCN amplification

Dirk Geerts et al. Int J Cancer. .

Abstract

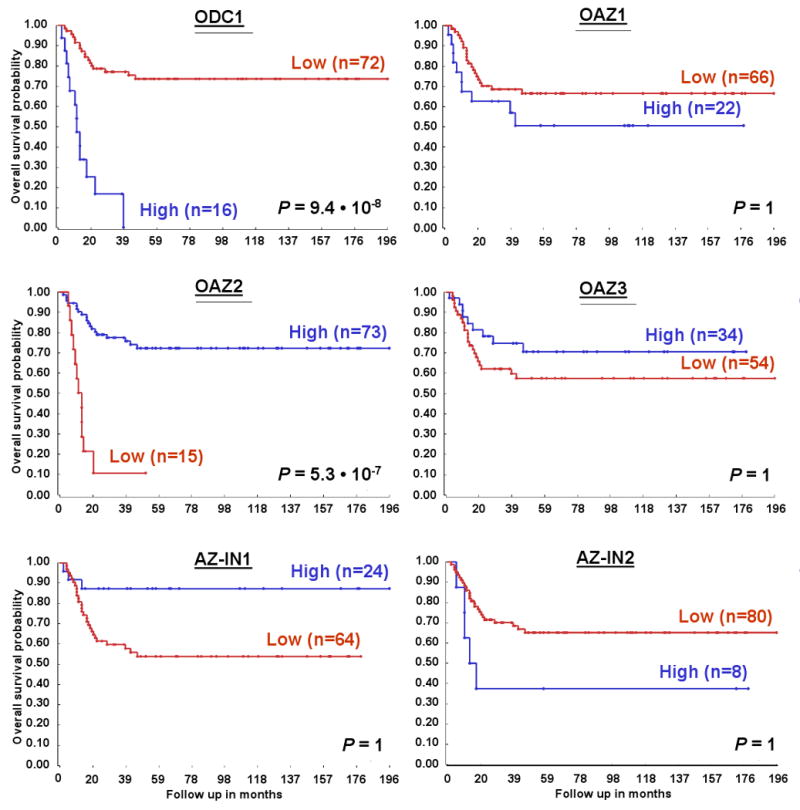
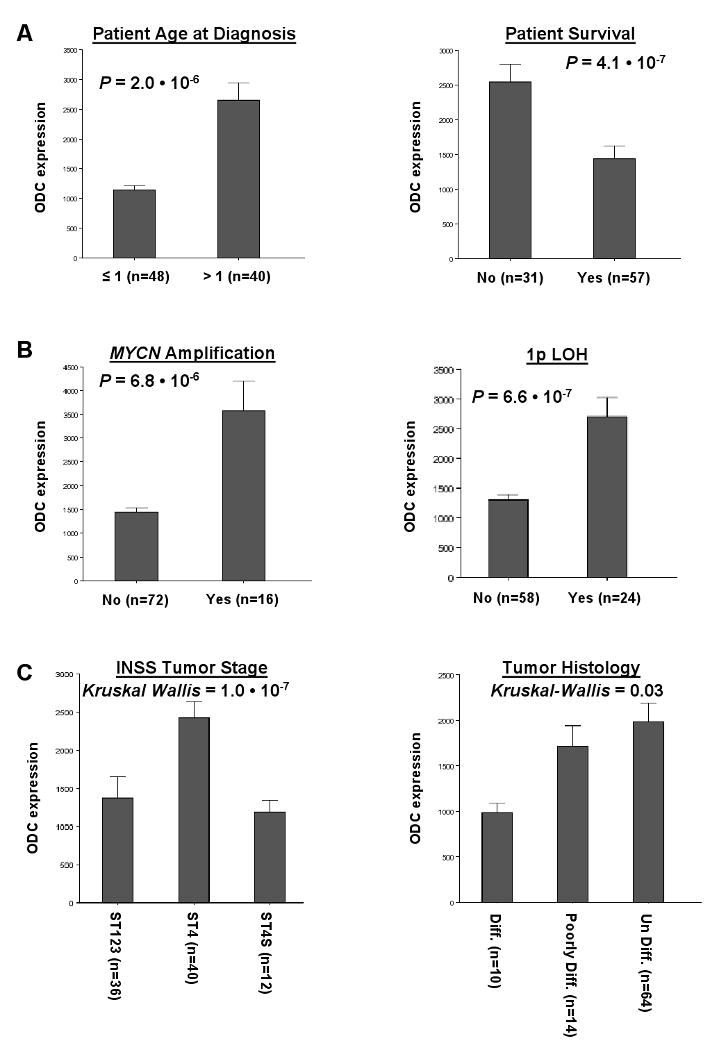
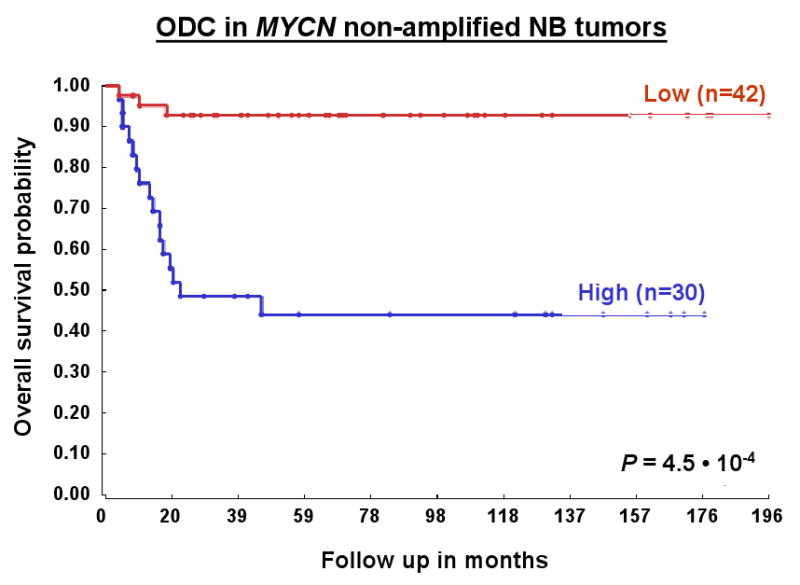
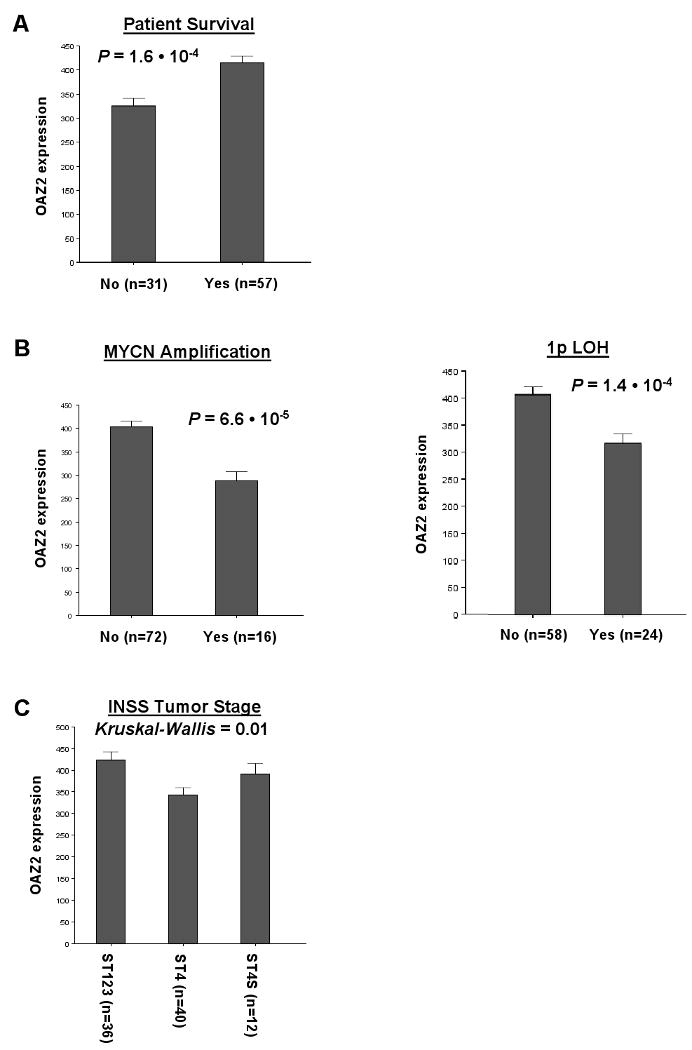
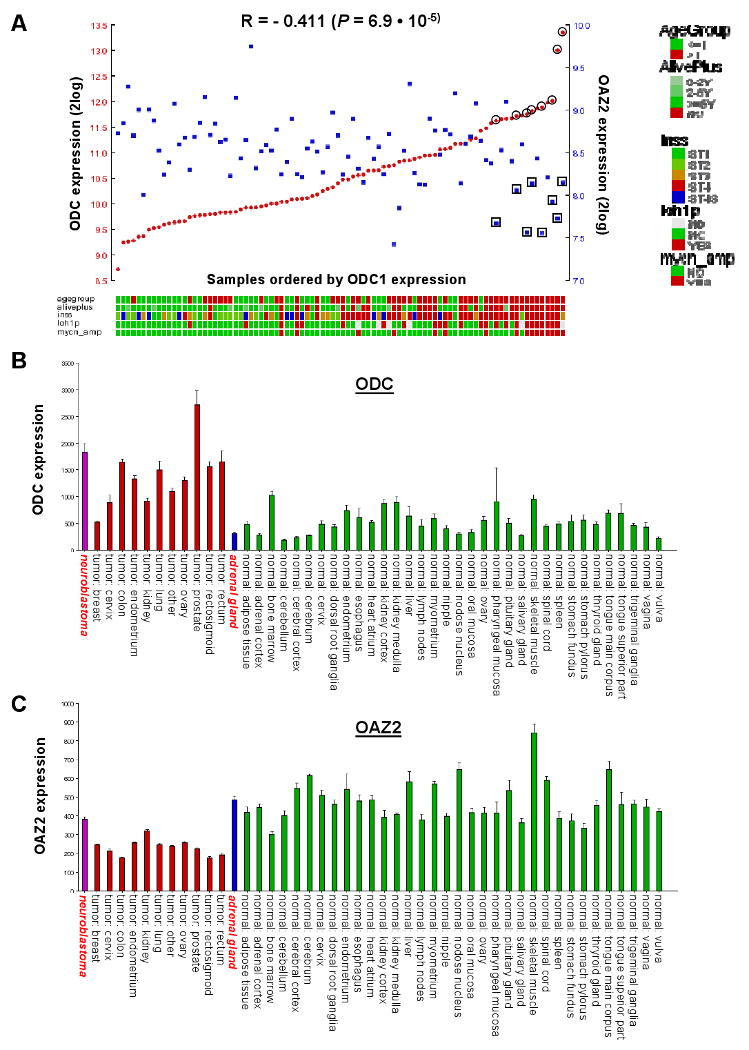
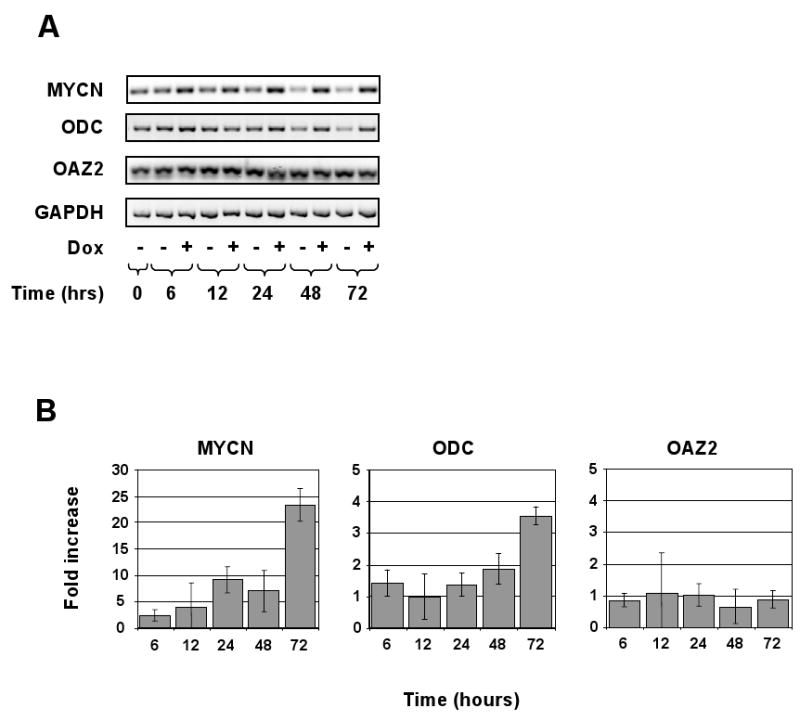
High polyamine (PA) levels and ornithine decarboxylase (ODC) overexpression are well-known phenomena in many aggressive cancer types. We analyzed the expression of ODC and ODC-activity regulating genes antizymes 1-3 (OAZ1-3) and antizyme inhibitors 1-2 (AZ-IN1-2) in human neuroblastoma (NB) tumors and correlated these with genetic and clinical features of NB. Since ODC is a known target gene of MYCN, the correlation between ODC and MYCN was of special interest. Data were obtained from Affymetrix micro-array analysis of 88 NB tumor samples. In addition, mRNA expression levels of ODC, OAZ2 and MYCN in a MYCN-inducible NB cell line were determined by quantitative real-time reverse-transcriptase polymerase chain reaction (RT-PCR). ODC mRNA expression in NB tumors was significantly predictive of decreased overall survival probability and correlated with several unfavorable clinical NB characteristics (all p < 0.005). Interestingly, high ODC mRNA expression also showed significant correlation with poor survival prognosis in Kaplan-Meier analyses stratified for patients without MYCN amplification, suggesting an additional role for ODC independent of MYCN. Conversely, high OAZ2 mRNA expression correlated with increased survival and with several favorable clinical NB characteristics (all p < 0.003). In addition, we provide first evidence of a role for MYCN-associated transcription factors MAD2 and MAD7 in ODC regulation. In NB cell cultures, ectopic overexpression of MYCN altered ODC but not OAZ2 mRNA levels. In conclusion, these data suggest that elevated ODC and low OAZ2 mRNA expression levels correlate with several unfavorable genetic and clinical features in NB, offering new insights into PA pathways and PA metabolism-targeting therapy in NB.


Conflict of interest statement

Conflict of interest statement: None declared.

Figures

Figure 1
Figure 1
Correlation of ODC and ODC activity-regulating gene expression with NB patient survival prognosis. Kaplan-Meier graphs representing the survival prognosis of 88 NB patients based on high or low expression levels of ODC, or of the ODC activity-regulating genes OAZ1, OAZ2, OAZ3 as well as AZ-IN1 and AZ-IN2. The survival probability of NB patients (follow-up over 196 months) with low ODC expression is significantly higher than of patients with high ODC expression. In contrast, patients with high OAZ2 expression have significantly better survival prognosis than patients with low OAZ2 expression. No significant correlations were apparent between patient survival prognosis and OAZ1, OAZ3, AZ-IN1, or AZ-IN2 expression; the differences seen between the “high” and “low” groups do not represent significantly different populations after Bonferoni correction for multiple testing. For the Kaplan-Meier analysis, the P values were calculated for all 72 groups tested. For ODC, the 72 “low” versus the 16 “high” group represents the highest P value (P = 9.4 · 10-8), but the P value was < 1.4 · 10-4 (P < 0.01, corrected for multiple testing) for all groups from 27 “low”/61 “high” to 79 “low”/9 “high”. For OAZ2, the 73 “high” versus the 15 “low” group represents the highest P value (P = 5.3 · 10-7), and in addition the P value was < 1.4 · 10-4 for all groups from 9 “low”/79 “high” to 25 “low”/63 “high”. Statistical analysis was performed with the log-rank test.
Figure 2
Figure 2
Correlation of ODC expression levels with important clinical features of NB. A, Correlation with patient data. Children with NB of ages >1 year (40 samples) show significantly higher ODC tumor expression than infants of ages <1 year (48 samples; P = 2.0 · 10-6). In addition, NB patients that have died before the moment of analysis (31 samples) expressed significantly higher ODC tumor levels than patients that were still alive at that time (57 samples; P = 4.1 · 10-7). B, Correlation with common genetic aberrations. NB tumors with MYCN amplification (16 samples) showed significantly higher ODC expression than tumors without MYCN amplification (72 samples; P = 6.8 · 10-6). Also, in NB tumors with 1p LOH (24 samples), ODC expression was significantly higher than in tumors without 1p loss (58 samples; P = 6.6 · 10-7). C, Correlation with tumor staging and histology. ODC expression was significantly elevated in high-stage tumors (ST4, 40 samples) compared to lower stage tumors (ST1-3, 36 samples and 4S, 12 samples; Kruskal-Wallis P = 1.0 · 10-7) tumors. The P values between ST1-3 and 4, and between ST4 and 4S were P = 2.7 · 10-9, and 3.3 · 10-5, respectively. ODC expression was lowest in differentiated NB tumors (10 samples), and higher in less differentiated NB tumors (poorly differentiated, 14 samples; or undifferentiated, 64 samples) (Kruskal-Wallis P = 0.03). The P value between differentiated NB tumors and poorly differentiated NB tumors was P = 5.4 · 10-3. Only significant correlations between ODC expression and NB clinical features are shown, for a list of correlations tested see Materials and Methods. Statistical analysis was performed using the non-parametric Mann-Whitney U test or Kruskal-Wallis tests where indicated. For reasons of representation, the bar plots show actual expression values. For expression value calculations, see Materials and Methods.
Figure 3
Figure 3
Prognostic significance of ODC expression in NB patients dependent on MYCN amplification status. Kaplan-Meier graphs representing the survival prognosis of 88 NB patients based on high or low expression levels of ODC separated for MYCN amplification status. NB72 represents the 72 patients without tumor MYCN amplification: The survival probability of NB patients with low ODC expression is significantly higher than of patients with high ODC expression (ODC expression cut-off point is 1,355). The ODC expression was between 420 and 3,383. For the Kaplan-Meier analysis, the P values were calculated for all 56 groups. For patients with NB without MYCN amplification, the 42 “low” versus the 30 “high” group represents the highest P value (P = 4.5 · 10-4), but the P value was < 1.8 · 10-4 (< 0.01 after correction for multiple testing) for all groups from 31 “low”/41 “high” to 56 “low”/16 “high”. P values were determined as described for Fig. 1. For the 16 patients with tumor MYCN amplification (NB16), no significant difference in survival prognosis could be found between patients with high ODC tumor expression and patients with low ODC tumor expression (not shown).
Figure 4
Figure 4
Correlation of OAZ2 expression levels with important clinical features of NB. A, Correlation with patient survival. Tumor samples from NB patients that have died before the moment of analysis (31 samples) exhibited significantly lower OAZ2 mRNA content than tumors from patients that were still alive at that time (57 samples; P = 1.6 · 10-4). B, Correlation with common genetic aberrations. NB tumors with MYCN amplification (16 samples) showed significantly lower OAZ2 expression than tumors without MYCN amplification (72 samples; P = 6.6 · 10-5). Also, in NB tumors with 1p LOH (24 samples), OAZ2 expression was significantly lower than in tumors without 1p loss (58 samples; P = 1.4 · 10-4). C, Correlation with INSS tumor staging. OAZ2 expression was significantly decreased in high-stage tumors (ST4, 40 samples) compared to lower stage tumors (ST1-3, 36 samples and 4S, 12 samples; Kruskal-Wallis P = 0.01) tumors. The P value between ST1-3 and 4 was P = 2.9 · 10-3. Only significant correlations between OAZ2 expression and NB clinical features are shown, for a list of correlations tested see Materials and Methods. Statistical analysis, bar plot representation, and expression value calculations are as in Figure 2.
Figure 5
Figure 5
ODC and OAZ2 expression in NB and other tumors and normal tissues. A, ODC and OAZ2 expression correlation in NB tumors: Visual representation of ODC and OAZ2 expression in all 88 NB tumors, ranked horizontally from left to right according to their ODC expression. ODC and OAZ2 expression values for each tumor are visualized with red circles and blue rectangles, respectively. The correlation between ODC and OAZ2 expression is r = -0.411, with a P value of 6.9 · 10-5 (2log Pearson). Below the graph is the clinical annotation of all 88 tumor samples, the annotation legend is to the right of the graph. Eight tumors expressing high levels of ODC as well as low levels of OAZ2 are marked by a double circle or rectangle; these are the 8 tumors with poor prognosis found in both the ODC and OAZ2 Kaplan-Meier analyses in Fig. 1. B, ODC Affymetrix expression profiling in three sets of expression data in the public domain: a set of 41 different human tumor types (EXPO, 1,908 samples total), a set of 65 different normal human tissue types (Roth, 353 samples total), normal adrenal gland tissue (13 samples), and a new set of NB tumors (88 samples). Average ODC expression was: EXPO 1,215 ± 25, Roth 436 ± 17, normal adrenal gland 313 ± 26, NB set 1,828 ± 159 (for comparison: GAPDH expression is 6,000-9,000). Set annotation is below the graph. NB tumors are shown in purple, other tumors in red, normal adrenal gland in blue and normal tissues (Roth) in green. NB tumors and normal adrenal gland are annotated in red, italics, boldface font. For reasons of representation, only Roth sets containing 4 or more samples are shown, the results remain similar to an analysis of the complete Roth set. C, OAZ2 Affymetrix expression profiling. Average OAZ2 expression was: EXPO 238 ± 2, Roth 528 ± 7, normal adrenal gland 488 ± 89, NB set 382 ± 12. Other details are as in A. Note the difference in ODC and OAZ2 expression in normal vs. tumor cervix, endometrium, and ovary tissue.
Figure 6
Figure 6
Expression of MYCN regulates ODC mRNA levels in the MYCN-2 NB cell line. A, The MYCN-inducible NB cell line MYCN-2 was used to determine the effect of ectopic MYCN expression on ODC mRNA levels. Cells were induced with doxycycline (Dox) or left untreated for 0, 6, 12, 24, 48, and 72 hours. RNA was isolated and reverse-transcriptase polymerase chain reaction (RT-PCR) performed using MYCN, ODC, OAZ2, and GAPDH (control) primers and the RT-PCR reaction was resolved by agarose gel electrophoresis. ODC mRNA expression was higher in cells that over-express MYCN. Data are representative of four independent experiments (n=4). B, The RNA samples shown in (A) were analyzed by real-time RT-PCR and the fold-change compared to control was determined.

References

    1. Brodeur GM. Neuroblastoma: biological insights into a clinical enigma. Nat Rev Cancer. 2003;3:203–16. - PubMed
    1. Maris JM, Hogarty MD, Bagatell R, Cohn SL. Neuroblastoma. Lancet. 2007;369:2106–20. - PubMed
    1. Cohn SL, Tweddle DA. MYCN amplification remains prognostically strong 20 years after its “clinical debut”. Eur J Cancer. 2004;40:2639–42. - PubMed
    1. Lu X, Pearson A, Lunec J. The MYCN oncoprotein as a drug development target. Cancer Lett. 2003;197:125–30. - PubMed
    1. Lutz W, Stohr M, Schurmann J, Wenzel A, Lohr A, Schwab M. Conditional expression of N-myc in human neuroblastoma cells increases expression of alpha-prothymosin and ornithine decarboxylase and accelerates progression into S-phase early after mitogenic stimulation of quiescent cells. Oncogene. 1996;13:803–12. - PubMed

Publication types