

Osmolyte-induced perturbations of hydrogen bonding between hydration layer waters: correlation with protein conformational changes
- PMID: 19961206
- PMCID: PMC3354986
- DOI: 10.1021/jp9072284
Osmolyte-induced perturbations of hydrogen bonding between hydration layer waters: correlation with protein conformational changes
Abstract
Gadolinium vibronic sideband luminescence spectroscopy (GVSBLS) is used to probe osmolyte-induced changes in the hydrogen bond strength between first and second shell waters on the surface of free Gd(3+) and Gd(3+) coordinated to EDTA and to structured calcium binding peptides in solution. In parallel, Raman is used to probe the corresponding impact of the same set of osmolytes on hydrogen bonding among waters in the bulk phase. Increasing concentration of added urea is observed to progressively weaken the hydrogen bonding within the hydration layer but has minimal observed impact on bulk water. In contrast, polyols are observed to enhance hydrogen bonding in both the hydration layer and the bulk with the amplitude being polyol dependent with trehalose being more effective than sucrose, glucose, or glycerol. The observed patterns indicate that the size and properties of the osmolyte as well as the local architecture of the specific surface site of hydration impact preferential exclusion effects and local hydrogen bond strength. Correlation of the vibronic spectra with CD measurements on the peptides as a function of added osmolytes shows an increase in secondary structure with added polyols and that the progressive weakening of the hydrogen bonding upon addition of urea first increases water occupancy within the peptide and only subsequently does the peptide unfold. The results support models in which the initial steps in the unfolding process involve osmolyte-induced enhancement of water occupancy within the interior of the protein.
Figures

 ) and presence of 2.0 M urea (
 ) and 8.0 M MgCl2 (
 ); b) water Raman for aqueous samples of 0.5 M GdCl3 in the absence of urea (
), 1 mM apo-mSE3 in 10mM HEPES buffer at pH 7.0 with 1 mM GdCl3 in the absence of urea (
); b) water Raman for aqueous samples of 0.5 M GdCl3 in the absence of urea (
), 1 mM apo-mSE3 in 10mM HEPES buffer at pH 7.0 with 1 mM GdCl3 in the absence of urea (
 ) and presence of 8.0 M urea (
 ); c) water Raman for aqueous samples of 0.5 M GdCl3 in the absence of urea (
), 100 mM EDTA in 10mM HEPES buffer at pH 7.0 with 80 mM GdCl3 in the absence of urea (
); c) water Raman for aqueous samples of 0.5 M GdCl3 in the absence of urea (
), 100 mM EDTA in 10mM HEPES buffer at pH 7.0 with 80 mM GdCl3 in the absence of urea (
 ) and presence of 8.0 M urea (
 ).
). ) water and trehalose solution with concentration of (
 ) 0.25 M, (
) 0.5 M and (
) 1.0 M; b) Difference water Raman spectra for (
) only water and glycerol solution with concentration (v/v) of (
) 10%, (
) 20%, (
) 30%, (
) 0.25 M, (
) 0.5 M and (
) 1.0 M; b) Difference water Raman spectra for (
) only water and glycerol solution with concentration (v/v) of (
) 10%, (
) 20%, (
) 30%, (
 ) 40%, (
 ) 50%, (
 ) 60%, (
) 70%, (
) 60%, (
) 70%, (
 ) 80% and (
 ) 90%; c) Difference water Raman spectra for (
) only water and PEG400 solution with concentration (v/v) of (
) 10%, (
) 20%, (
) 30%, (
) 40%, (
) 90%; c) Difference water Raman spectra for (
) only water and PEG400 solution with concentration (v/v) of (
) 10%, (
) 20%, (
) 30%, (
) 40%, (
 ) 50%, (
) 60%, (
) 50%, (
) 60%, (
 ) 70%, (
 ) 80%.

 absence of urea and presence of
 2.0 M urea and
 8.0 M urea. b) Normalized OH vibronic side band derived from GVSBLS of 100 mM EDTA with 80 mM Gd3+ in 10 mM HEPES buffer at pH 7.0 in the
absence and
presence of 1 M urea; c) Bar graph of −OH stretching mode vibration frequency shifts induced by additions of varied concentrations of urea derived from:
8.0 M urea. b) Normalized OH vibronic side band derived from GVSBLS of 100 mM EDTA with 80 mM Gd3+ in 10 mM HEPES buffer at pH 7.0 in the
absence and
presence of 1 M urea; c) Bar graph of −OH stretching mode vibration frequency shifts induced by additions of varied concentrations of urea derived from:
 water Raman of free 0.5 M Gd3+ solution,
 GVSBLS of free 0.5 M Gd3+ solution or
GVSBLS of 100 mM EDTA with 80 mM Gd3+ in 10 mM HEPES buffer at pH 7.0
GVSBLS of free 0.5 M Gd3+ solution or
GVSBLS of 100 mM EDTA with 80 mM Gd3+ in 10 mM HEPES buffer at pH 7.0 water Raman of 0.5 M GdCl3 solution,
 GVSBLS of 0.5 M GdCl3 solution or
 GVSBLS of 100 mM EDTA with 80 mM Gd3+ in 10 mM HEPES buffer at pH 7.0 and
 GVSBLS of 1 mM apo-mSE3 in 10mM HEPES buffer at pH 7.0 with 1 mM GdCl3.
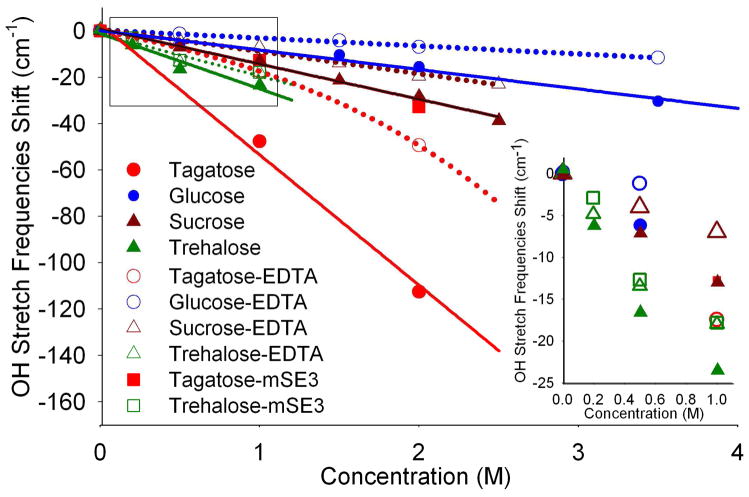
 tagatose,
 glucose,
 sucrose and
 trehalose. Also depicts the OH stretch mode frequency shifts of 100 mM EDTA with 80 mM Gd3+ in 10 mM HEPES buffer at pH 7.0 induced by addition of varied concentrations of
 tagatose,
 glucose,
 sucrose and
 trehalose. Also compares the OH stretch mode frequency shifts of 1 mM apo-mSE3 in 10mM HEPES buffer at pH 7.0 with 1 mM GdCl3 induced by addition of varied concentrations of
 tagatose and
 trehalose. Inset: enlarged area of the drawn box.
 absence of osmolytes and presence of
2.0 M urea,
1.0 M trehalose and
absence of osmolytes and presence of
2.0 M urea,
1.0 M trehalose and
 2.0 M urea with 1.0 M trehalose. b) Normalized OH vibronic side band derived from GVSBLS of 100 mM EDTA with 80 mM Gd3+ in 10 mM HEPES buffer at pH 7.0 in the
absence of osmolytes and presence of
1.0 M urea,
1.0 M trehalose and
2.0 M urea with 1.0 M trehalose. b) Normalized OH vibronic side band derived from GVSBLS of 100 mM EDTA with 80 mM Gd3+ in 10 mM HEPES buffer at pH 7.0 in the
absence of osmolytes and presence of
1.0 M urea,
1.0 M trehalose and
 1.0 M urea with 1.0 M trehalose.
 alone;
5.0 M urea;
5.5 M urea;
alone;
5.0 M urea;
5.5 M urea;
 6.0 M urea;
7.5 M urea;
8.0 M urea;
6.0 M urea;
7.5 M urea;
8.0 M urea;
 60% (v/v) glycerol and
 1.0 M trehalose.
 50% glycerol,
 0.5 M trehalose and
 1.0 M tagatose.
 trehalose and
 tagatose induced OH stretching frequency shifts of the first hydration layer waters coordinated to mSE3 bound with Gd3+ as a function of percentage of α-helix contents calculated as described in method section.
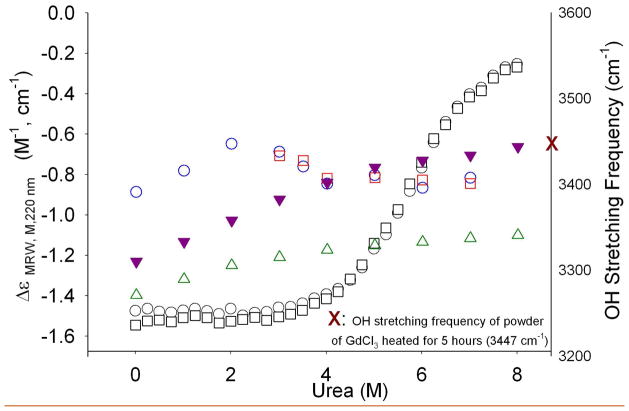 ) mSE3 and (
 ) SE2 peptide, (
) free GdCl3 and (
) SE2 peptide, (
) free GdCl3 and (
 ) EDTA-Gd3+ solution. The OH stretching frequency of GdCl3 powder heated for 5 hours is also marked (
 ).
).
 sucrose,
 glucose and
 trehalose on a basis of per molarity as a function of osmolytes limiting diffusion coefficients.
Similar articles
-
Charge density-dependent modifications of hydration shell waters by Hofmeister ions.J Am Chem Soc. 2009 Aug 12;131(31):11010-8. doi: 10.1021/ja902240j. J Am Chem Soc. 2009. PMID: 19603752 Free PMC article.
-
Molecular level probing of preferential hydration and its modulation by osmolytes through the use of pyranine complexed to hemoglobin.J Biol Chem. 2006 Dec 15;281(50):38757-68. doi: 10.1074/jbc.M608835200. Epub 2006 Oct 22. J Biol Chem. 2006. PMID: 17057250
-
Investigating the Counteracting Effect of Trehalose on Urea-Induced Protein Denaturation Using Molecular Dynamics Simulation.J Phys Chem B. 2015 Aug 27;119(34):10975-88. doi: 10.1021/acs.jpcb.5b01457. Epub 2015 Jul 16. J Phys Chem B. 2015. PMID: 26147245
-
Interactions of S-peptide analogue in aqueous urea and trimethylamine-N-oxide solutions: a molecular dynamics simulation study.J Chem Phys. 2013 Jul 21;139(3):034504. doi: 10.1063/1.4813502. J Chem Phys. 2013. PMID: 23883044
-
Chemistry of Hofmeister anions and osmolytes.Annu Rev Phys Chem. 2010;61:63-83. doi: 10.1146/annurev.physchem.59.032607.093635. Annu Rev Phys Chem. 2010. PMID: 20055667 Review.
Cited by
-
Biophysical Elucidation of Fibrillation Inhibition by Sugar Osmolytes in α-Lactalbumin: Multispectroscopic and Molecular Docking Approaches.ACS Omega. 2020 Oct 8;5(41):26871-26882. doi: 10.1021/acsomega.0c04062. eCollection 2020 Oct 20. ACS Omega. 2020. PMID: 33111013 Free PMC article.
-
Unexplored Excipients in Biotherapeutic Formulations: Natural Osmolytes as Potential Stabilizers Against Thermally Induced Aggregation of IgG1 Biotherapeutics.AAPS PharmSciTech. 2021 Dec 14;23(1):26. doi: 10.1208/s12249-021-02183-8. AAPS PharmSciTech. 2021. PMID: 34907498 Free PMC article.
-
Combinations of Osmolytes, Including Monosaccharides, Disaccharides, and Sugar Alcohols Act in Concert During Cryopreservation to Improve Mesenchymal Stromal Cell Survival.Tissue Eng Part C Methods. 2016 Nov;22(11):999-1008. doi: 10.1089/ten.TEC.2016.0284. Epub 2016 Oct 27. Tissue Eng Part C Methods. 2016. PMID: 27758133 Free PMC article.
-
Solute's perspective on how trimethylamine oxide, urea, and guanidine hydrochloride affect water's hydrogen bonding ability.J Phys Chem B. 2012 Oct 18;116(41):12473-8. doi: 10.1021/jp307414s. Epub 2012 Oct 9. J Phys Chem B. 2012. PMID: 22998405 Free PMC article.
-
Selective inhibition of aggregation/fibrillation of bovine serum albumin by osmolytes: Mechanistic and energetics insights.PLoS One. 2017 Feb 16;12(2):e0172208. doi: 10.1371/journal.pone.0172208. eCollection 2017. PLoS One. 2017. PMID: 28207877 Free PMC article.
References
Publication types
MeSH terms
Substances
Grants and funding
LinkOut - more resources
Full Text Sources
Other Literature Sources
