

Identification and confirmation of biomarkers using an integrated platform for quantitative analysis of glycoproteins and their glycosylations
- PMID: 19961239
- PMCID: PMC2838716
- DOI: 10.1021/pr900715p
Identification and confirmation of biomarkers using an integrated platform for quantitative analysis of glycoproteins and their glycosylations
Abstract
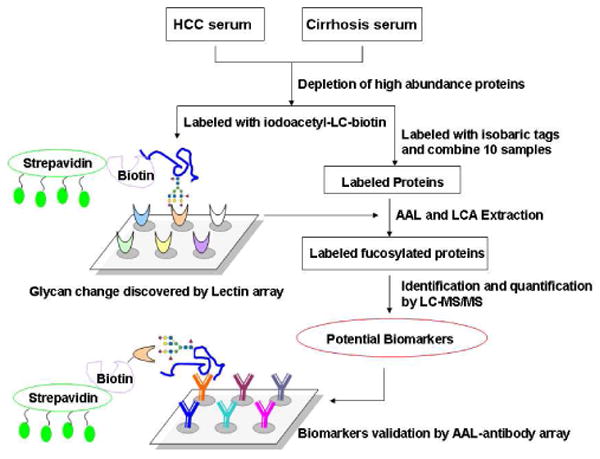
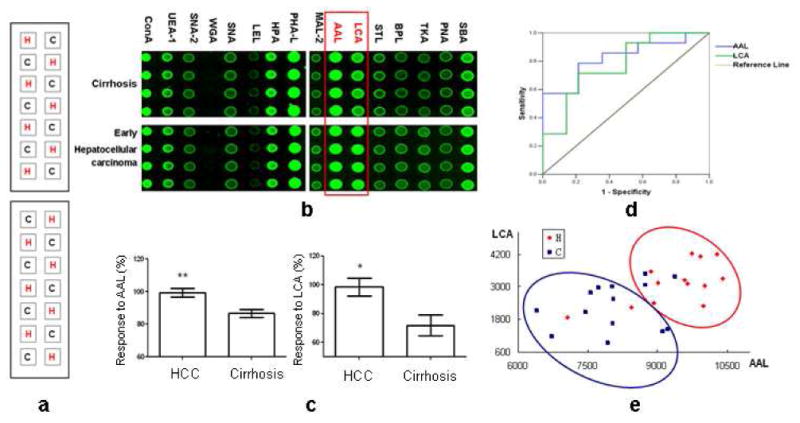
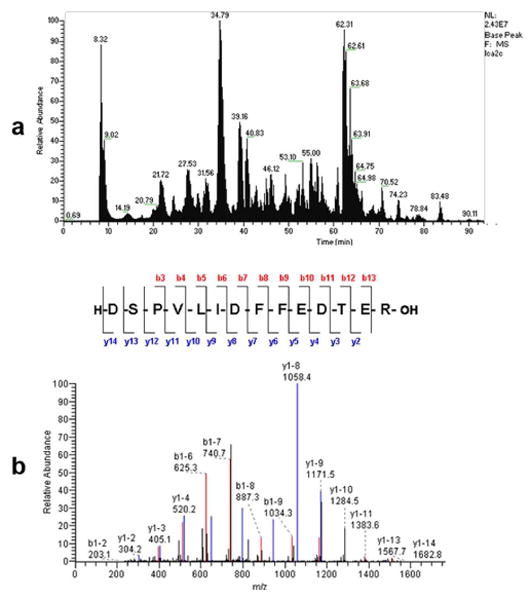
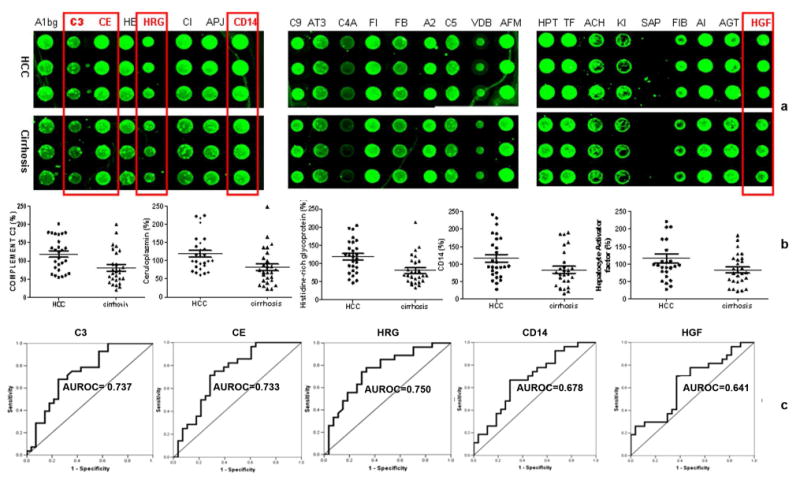
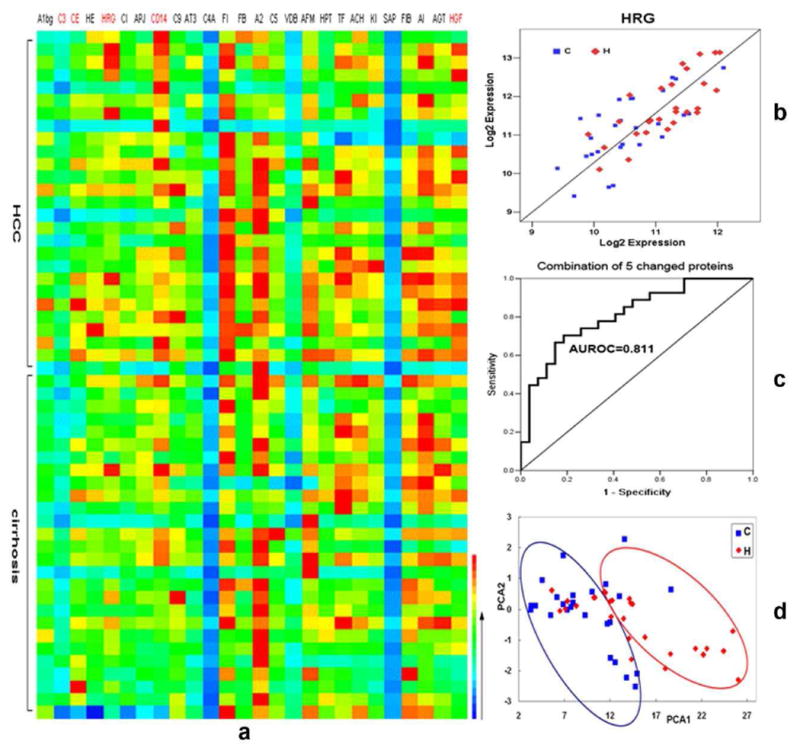
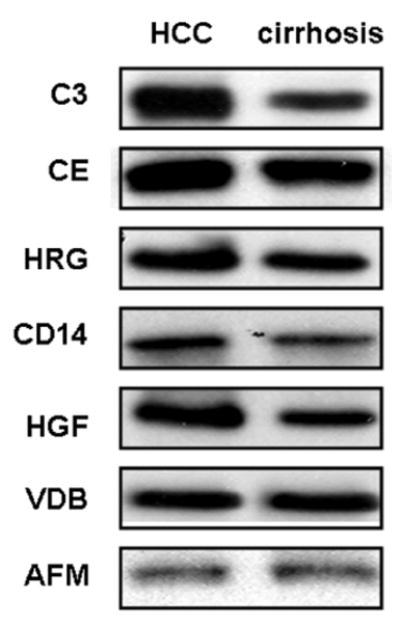
Hepatocellular carcinoma (HCC) is the most common primary malignant tumor of the liver. However, accurate diagnosis can be difficult as most of the patients who develop this tumor have symptoms similar to those caused by longstanding liver disease. Herein we developed an integrated platform to discover the glycoprotein biomarkers in early HCC. At first, lectin arrays were applied to investigate the differences in glycan structures on serum glycoproteins from HCC and cirrhosis patients. The intensity for AAL and LCA was significantly higher in HCC, indicating an elevation of fucosylation level. Then serum from 10 HCC samples and 10 cirrhosis samples were used to screen the altered fucosylated proteins by a combination of Exactag labeling, lectin extraction and LC-MS/MS. Finally, 27 HCC and 27 cirrhosis serum samples were used for lectin-antibody arrays to confirm the change of these fucosylated proteins. C3, CE, HRG, CD14 and HGF were found to be biomarker candidates for distinguishing early HCC from cirrhosis, with a sensitivity of 72% and specificity of 79%. Our work gives insight to the detection of early HCC, and the application of this comprehensive strategy has the potential to facilitate biomarker discovery on a large scale.
Figures
Similar articles
-
Glycoproteomic markers of hepatocellular carcinoma-mass spectrometry based approaches.Mass Spectrom Rev. 2019 May;38(3):265-290. doi: 10.1002/mas.21583. Epub 2018 Nov 25. Mass Spectrom Rev. 2019. PMID: 30472795 Free PMC article. Review.
-
Serum paraoxonase 1 heteroplasmon, a fucosylated, and sialylated glycoprotein in distinguishing early hepatocellular carcinoma from liver cirrhosis patients.Acta Biochim Biophys Sin (Shanghai). 2012 Sep;44(9):765-73. doi: 10.1093/abbs/gms055. Epub 2012 Jul 1. Acta Biochim Biophys Sin (Shanghai). 2012. PMID: 22751611
-
Identification and confirmation of differentially expressed fucosylated glycoproteins in the serum of ovarian cancer patients using a lectin array and LC-MS/MS.J Proteome Res. 2012 Sep 7;11(9):4541-52. doi: 10.1021/pr300330z. Epub 2012 Aug 6. J Proteome Res. 2012. PMID: 22827608
-
LC-MS/MS isomeric profiling of permethylated N-glycans derived from serum haptoglobin of hepatocellular carcinoma (HCC) and cirrhotic patients.Electrophoresis. 2017 Sep;38(17):2160-2167. doi: 10.1002/elps.201700025. Epub 2017 Jul 14. Electrophoresis. 2017. PMID: 28543513 Free PMC article.
-
Lectin-based glycoproteomics to explore and analyze hepatocellular carcinoma-related glycoprotein markers.Electrophoresis. 2009 Sep;30(17):2957-2966. doi: 10.1002/elps.200900064. Electrophoresis. 2009. PMID: 19711376 Review.
Cited by
-
Isobaric protein-level labeling strategy for serum glycoprotein quantification analysis by liquid chromatography-tandem mass spectrometry.Anal Chem. 2013 Jun 4;85(11):5353-7. doi: 10.1021/ac400838s. Epub 2013 May 17. Anal Chem. 2013. PMID: 23638883 Free PMC article.
-
Baseline Circulating miR-125b Levels Predict a High FIB-4 Index Score in Chronic Hepatitis B Patients after Nucleos(t)ide Analog Treatment.Biomedicines. 2022 Nov 5;10(11):2824. doi: 10.3390/biomedicines10112824. Biomedicines. 2022. PMID: 36359344 Free PMC article.
-
Potential Biomarkers for Liver Cancer Diagnosis Based on Multi-Omics Strategy.Front Oncol. 2022 Feb 3;12:822449. doi: 10.3389/fonc.2022.822449. eCollection 2022. Front Oncol. 2022. PMID: 35186756 Free PMC article. Review.
-
Mass spectrometry-based N-glycoproteomics for cancer biomarker discovery.Clin Proteomics. 2014 May 5;11(1):18. doi: 10.1186/1559-0275-11-18. eCollection 2014. Clin Proteomics. 2014. PMID: 24872809 Free PMC article. Review.
-
Identification of Fucosylated SERPINA1 as a Novel Plasma Marker for Pancreatic Cancer Using Lectin Affinity Capture Coupled with iTRAQ-Based Quantitative Glycoproteomics.Int J Mol Sci. 2021 Jun 4;22(11):6079. doi: 10.3390/ijms22116079. Int J Mol Sci. 2021. PMID: 34199928 Free PMC article.
References
-
- Ferlay J, Bray F, Pisani P, Parkin D. IARC CancerBase. No 5. IARCPress; Lyon: 2004. GLOBOCAN 2002: Cancer Incidence, Mortality and Prevalence Worldwide. version 2.0.
-
- El-Serag HB. Hepatocellular carcinoma: recent trends in the United States. Gastroenterology. 2004;127(5 Suppl 1):S27–34. - PubMed
-
- Parkin DM. The global health burden of infection-associated cancers in the year 2002. Int J Cancer. 2006;118(12):3030–44. - PubMed
-
- El-Serag HB, Mason AC, Key C. Trends in survival of patients with hepatocellular carcinoma between 1977 and 1996 in the United States. Hepatology. 2001;33(1):62–5. - PubMed
-
- Majno P, Giostra E, Morel P, Hadengue A, Mentha G. Management of hepatocellular carcinoma in the waiting list before liver transplantation. J Hepatol. 2005;42 1:S134–43. - PubMed
Publication types
MeSH terms
Substances
Grants and funding
LinkOut - more resources
Full Text Sources
Other Literature Sources
Research Materials
Miscellaneous
