. 2010 Jan;101(1):267-73.
doi: 10.1111/j.1349-7006.2009.01384.x. Epub 2009 Oct 8.

Imaging mass spectrometry of gastric carcinoma in formalin-fixed paraffin-embedded tissue microarray

Affiliations

Imaging mass spectrometry of gastric carcinoma in formalin-fixed paraffin-embedded tissue microarray

Yoshifumi Morita et al. Cancer Sci. 2010 Jan.

Abstract

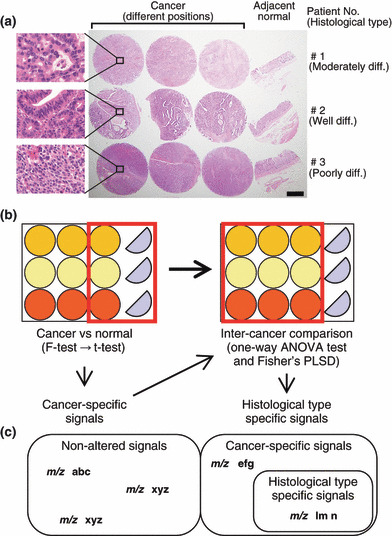
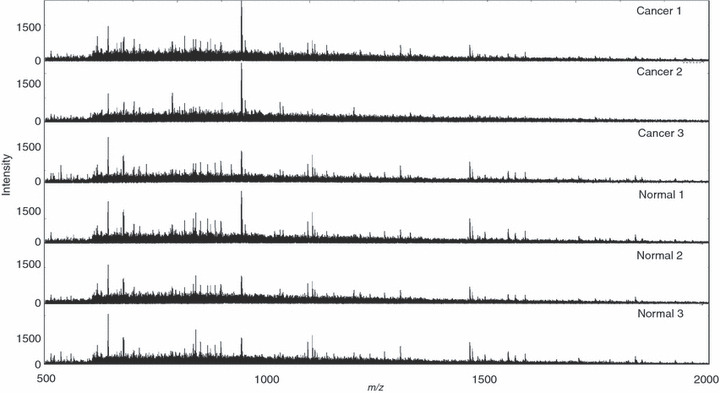
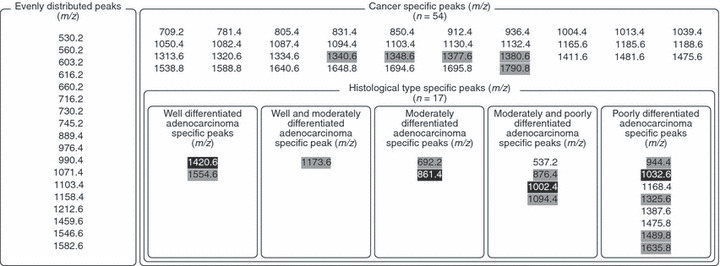
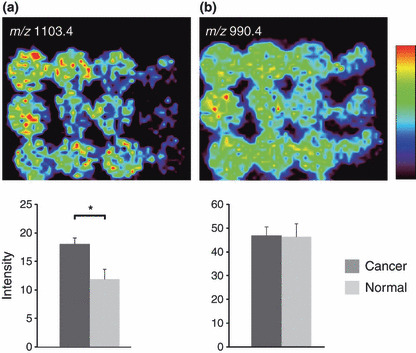
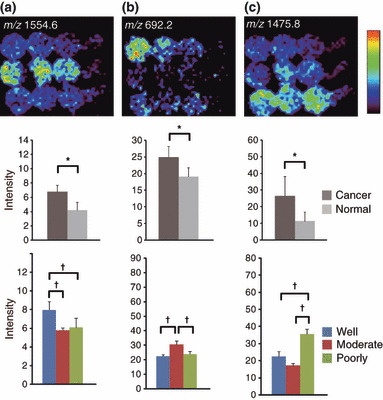
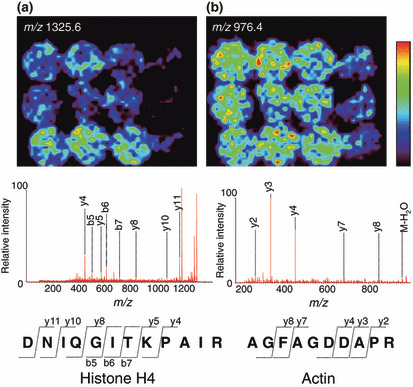
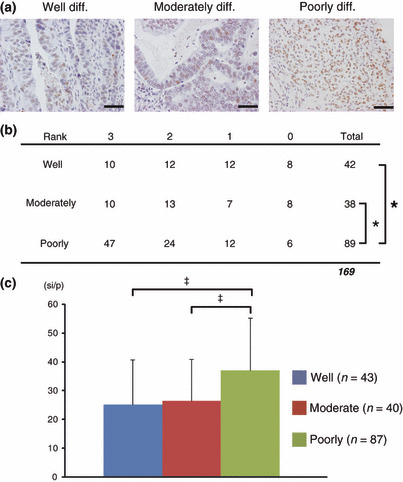
The popularity of imaging mass spectrometry (IMS) of tissue samples, which enables the direct scanning of tissue sections within a short time-period, has been considerably increasing in cancer proteomics. Most pathological specimens stored in medical institutes are formalin-fixed; thus, they had been regarded to be unsuitable for proteomic analyses, including IMS, until recently. Here, we report an easy-to-use screening method that enables the analysis of multiple samples in one experiment without extractions and purifications of proteins. We scanned, with an IMS technique, a tissue microarray (TMA) of formalin-fixed paraffin-embedded (FFPE) specimens. We detected a large amount of signals from trypsin-treated FFPE-TMA samples of gastric carcinoma tissues of different histological types. Of the signals detected, 54 were classified as signals specific to cancer with statistically significant differences between adenocarcinomas and normal tissues. We detected a total of 14 of the 54 signals as histological type-specific with the support of statistical analyses. Tandem MS revealed that a signal specific to poorly differentiated cancer tissue corresponded to histone H4. Finally, we verified the IMS-based finding by immunohistochemical analysis of more than 300 specimens spotted on TMAs; the immunoreactivity of histone H4 was remarkably strong in poorly differentiated cancer tissues. Thus, the application of IMS to FFPE-TMA can enable high-throughput analysis in cancer proteomics to aid in the understanding of molecular mechanisms underlying carcinogenesis, invasiveness, metastasis, and prognosis. Further, results obtained from the IMS of FFPE-TMA can be readily confirmed by commonly used immunohistochemical analyses.


Figures

Figure 1
Figure 1
Experimental paradigm design. (a) Formalin‐fixed paraffin‐embedded (FFPE) samples were cored with a 3‐mm diameter needle and arranged in a line with three cancer tissues and one adjacent normal tissue. The histological type of the cancer of Patient 1 was moderately differentiated adenocarcinoma, that of Patient 2 was well‐differentiated adenocarcinoma, and that of Patient 3 was poorly differentiated adenocarcinoma. Hematoxylin–eosin stain, ×10. Scale bar, 1 mm. Enclosed area corresponded to magnified microscopic image. Hematoxylin–eosin stain, ×400 (b) The schema of FFPE samples and the workflow of statistical analysis are shown. (c) The schema that categorizes the acquired signals is presented.
Figure 2
Figure 2
Acquired mass spectra from formalin‐fixed paraffin‐embedded (FFPE) tissue microarray samples (TMA) by random laser irradiation. Acquired mass spectra from each TMA spot of adjoining cancer and normal tissue are shown as representative spectra. m/z refers to mass per charge ratio.
Figure 3
Figure 3
The peak list acquired from mass spectra. The shaded values represent signals that showed significantly increased intensity in cancer tissues in one independent trial (P < 0.05). The white‐on‐black values represent signals that showed significant difference among three cancers in one independent trial (P < 0.05).
Figure 4
Figure 4
Cancer‐specific signal increase and even distribution of signals in imaging mass spectrometry (IMS) of digested formalin‐fixed paraffin‐embedded (FFPE) tissue microarrays (TMA). (a) Significantly strong peak intensity was detected at m/z 1103.4. (b) No significant difference was observed between cancer and normal tissues at an m/z of 990.4. Values are represented as mean ± SD (n = 3). *P < 0.05.
Figure 5
Figure 5
Histological type‐specific signal increase in imaging mass spectrometry (IMS) of digested formalin‐fixed paraffin‐embedded (FFPE) tissue microarrays (TMA). (a) Ion imaging revealed a peak with significantly strong signal intensity in well‐differentiated adenocarcinoma at an m/z of 1554.6. (b) Ion imaging revealed a peak with significantly strong signal intensity in moderately differentiated adenocarcinoma at an m/z of 692.2. (c) Ion imaging revealed a peak with significantly strong signal intensity in poorly differentiated adenocarcinoma at m/z 1475.8. Values are represented as mean ± SD (n = 3). *P <0.05, †P <0.05.
Figure 6
Figure 6
MS/MS analysis of digested peptide and protein identification. (a) The biomolecule of an m/z 1325.6 was identified as histone H4. DNIQGITKPAIR: abbreviation of the amino‐acid sequence aspartic acid–asparagine–isoleucine–glutamine–glycine–isoleucine–threonine–lysine–proline–alanine–isoleucine–arginine. y4, y5, y8, y10, y11 represent each fragment ion, which includes the C‐terminal domain. b5, b6, b7 represent each fragment ion, which includes the N‐terminal domain. (b) The biomolecule with an m/z 976.4 was identified as actin. AGFAGDDAPR: abbreviation for the amino‐acid sequence alanine–glycine–phenylalanine–alanine–glycine–aspartic acid–aspartic acid–alanine–proline–arginine. y2, y3, y4, y7, y8 refer to each fragment ion, which includes the C‐terminal domain.
Figure 7
Figure 7
Immunohistochemical (IHC) staining for histone H4. (a) Representative photomicrograph of IHC for histone H4 protein, ×400. Scale bar, 50 μm. (b) Evaluation of IHC according to four ranks (0, negative; 1, slightly positive; 2, positive; 3, strongly positive). The 169 gastric carcinomas comprised 42 well‐differentiated carcinomas, 38 moderately differentiated carcinomas, 89 poorly differentiated carcinomas. *P < 0.05 by Steel–Dwass’ test. (c) Quantitative analysis of IHC signal intensity. The 170 gastric carcinomas comprised 43 well‐differentiated carcinomas, 40 moderately differentiated carcinomas, and 87 poorly differentiated carcinomas. Values are represented as mean ± SD. si/p, signal intensity per pixel. ‡P < 0.01.

References

    1. DeRisi J, Penland L, Brown PO et al. Use of a cDNA microarray to analyse gene expression patterns in human cancer. Nat Genet 1996. Dec; 14 (4): 457–60. - PubMed
    1. Ramsay G. DNA chips: state‐of‐the art. Nat Biotechnol 1998. Jan; 16 (1): 40–4. - PubMed
    1. Zhao X, Li C, Paez JG et al. An integrated view of copy number and allelic alterations in the cancer genome using single nucleotide polymorphism arrays. Cancer Res 2004. May 1; 64 (9): 3060–71. - PubMed
    1. Engle LJ, Simpson CL, Landers JE. Using high‐throughput SNP technologies to study cancer. Oncogene 2006. Mar 13; 25 (11): 1594–601. - PubMed
    1. McLendon R, Friedman A, Bigner D et al. Comprehensive genomic characterization defines human glioblastoma genes and core pathways. Nature 2008. Oct 23; 455 (7216): 1061–8. - PMC - PubMed

Publication types