. 2010 Mar;101(3):713-21.
doi: 10.1111/j.1349-7006.2009.01421.x. Epub 2009 Oct 31.

Gap junctions sensitize cancer cells to proteasome inhibitor MG132-induced apoptosis

Affiliations

Gap junctions sensitize cancer cells to proteasome inhibitor MG132-induced apoptosis

Tao Huang et al. Cancer Sci. 2010 Mar.

Abstract

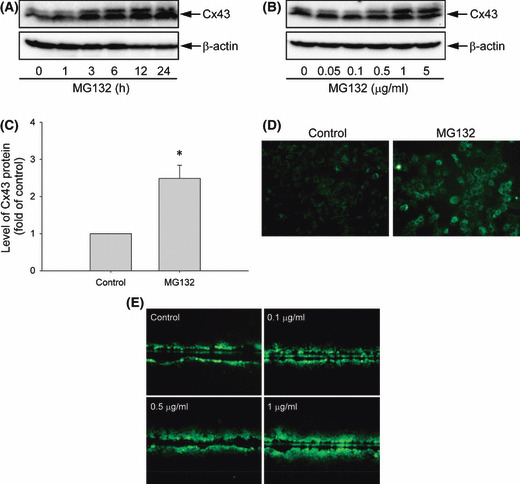
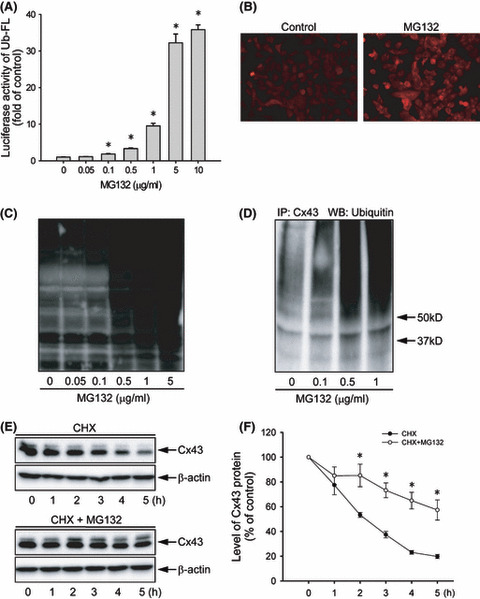
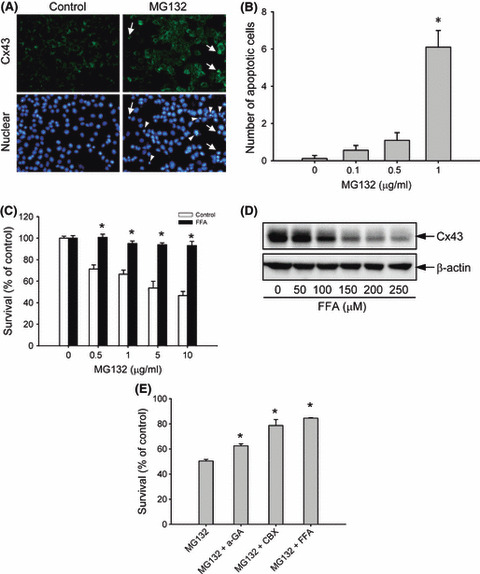
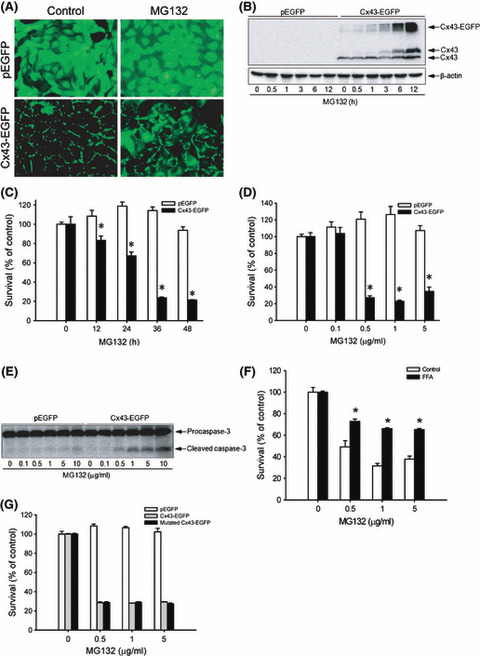
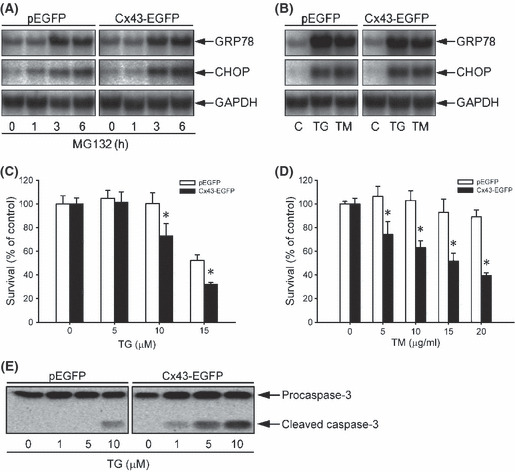
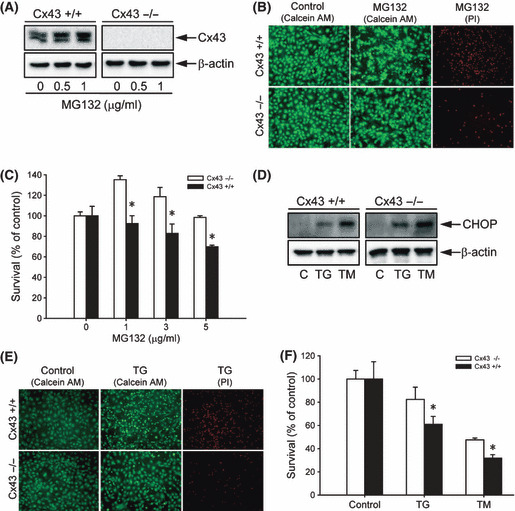
Proteasome inhibition is a promising approach for cancer therapy. However, the mechanisms involved have not been fully elucidated. Gap junctions play important roles in the regulation of tumor cell phenotypes and mediation of the bystander effect in cancer therapy. Because the degradation of gap junction proteins involves the proteasome, we speculated that altered gap junctions might contribute to the antitumor activities of proteasome inhibition. Incubation of Hepa-1c1c7 cells with the proteasome inhibitor MG132 elevated the levels of gap junction protein connexin 43 (Cx43) and promoted gap junctional intercellular communication. This was associated with a marked accumulation of ubiquitylated Cx43 and a significantly decreased rate of Cx43 degradation. The elevated Cx43 contributed to MG132-induced cell apoptosis. This is shown by the observations that: (i) overexpression of Cx43 in the gap junction-deficient LLC-PK1 cells rendered them vulnerable to MG132-elicited cell injury; (ii) fibroblasts derived from Cx43-null mice were more resistant to MG-132 compared with Cx43 wild-type control; and (iii) the gap junction inhibitor flufenamic acid significantly attenuated cell damage caused by MG132 in Hepa-1c1c7 cells. Further studies demonstrated that MG132 activates endoplasmic reticulum stress. Exposure of cells to the endoplasmic reticulum stress inducers thapsigargin and tunicamycin also led to cell apoptosis, which was modulated by Cx43 levels in a way similar to MG132. These results suggested that elevated Cx43 sensitizes cells to MG132-induced cell apoptosis. Regulation of gap junctions could be an important mechanism behind the antitumor activities of proteasome inhibitors.


Figures

Figure 1
Figure 1
Effects of MG132 on connexin 43 (Cx43) protein expression, distribution, and function in Hepa‐1c1c7 cells. (A–C) Effects of MG132 on Cx43 protein levels. 1c1c‐7 cells were exposed to (A) 0.5 μg/mL MG132 for the indicated times or (B) various concentrations of MG132 for 12 h. The cellular protein was extracted and subjected to western blot analysis of Cx43. Expression of β‐actin is shown at the bottom as a loading control. (C) The intensities of Cx43 signal in cells treated with 0.5 μg/mL MG132 for 12 h were measured and expressed as fold induction relative to untreated control (mean ± SE, n =5). *P <0.01 versus untreated control. (D) Immunofluorescence staining of Cx43. Hepa‐1c1c7 cells were either left untreated or incubated with 0.5 μg/mL MG132 for 12 h, and then subjected to immunofluorescence staining of Cx43 (green). Note the obvious enhancement of Cx43 (green) at the perinuclear region and cell‐to‐cell contacts. Magnification, ×400. (E) Effects of MG132 on gap junctional intercellular communication measured by scrape loading dye transfer assay. Hepa‐1c1c7 cells were either left untreated or exposed to increasing concentrations of MG132 for 12 h. The micrographs of Lucifer Yellow diffusion into the cellular monolayer after scrape‐loading are shown. Magnification, ×200.
Figure 2
Figure 2
Effect of MG132 on proteasome function and connexin 43 (Cx43) degradation. (A) Effect of MG132 on ubiquitin–luciferase bioluminescence imaging reporter (Ub‐FL) activity. Hepa‐1c1c7 cells were transiently transfected with a Ub‐FL reporter and exposed to the indicated concentrations of MG132. The relative luciferase activity is expressed as fold induction over untreated control (mean ± SE, n =4). *P <0.01 versus untreated control. (B) Immunofluorescent staining for ubiquitin. Hepa‐1c1c7 cells were either left untreated or incubated with 0.5 μg/mL MG132 for 12 h, and then subjected to immunofluorescent staining of ubiqutin (red). Note the obvious enhanced intensity of ubiqutin (red) at the perinuclear region. Magnification, ×400. (C) Effect of MG132 on protein ubiqutiylation. Hepa‐1c1c7 cells were exposed to various concentrations of MG132 for 12 h. The cellular protein was extracted and subjected to western blotting analysis of ubiquitylated proteins. (D) Effect of MG132 on ubiquitylation of Cx43. Hepa‐1c1c7 cells were treated with the indicated concentrations of MG132 for 12 h. Cell lysates were subjected to immunoprecipitation (IP) with an anti‐Cx43 antibody and blotted with an anti‐ubiquitin antibody. (E) Effect of MG132 on Cx43 protein degradation. Hepa‐1c1c7 cells were exposed to 50 μg/mL cycloheximide (CHX) in the presence or absence of 0.5 μg/mL MG132 for the indicated times. Cellular proteins were analyzed by western blotting (WB) with an anti‐Cx43 antibody. A representative blot is shown in (E). (F) The intensity of each Cx43 signal in (E) was measured and the relative intensity of the band against its intensity at zero point are shown (mean ± SE, n =4). *P <0.01 versus untreated control.
Figure 3
Figure 3
Involvement of gap junctions in MG132‐induced cell damage. (A) Concomitant induction of connexin 43 (Cx43) and cell apoptosis by MG132. Hepa‐1c1c7 cells were either left untreated or incubated with 1 μg/mL MG132 for 12 h, and then subjected to immunofluorescence staining of Cx43 (green; upper panel) and nuclei (DAPI stain, blue; lower panel). Arrow and arrow heads indicate apoptotic cells. Note the coexistence of elevated Cx43 and nuclear condensation in part of the indicated cells. Magnification, ×400. (B) The number of apoptotic cells after MG132 treatment. The cells with nuclear condensation and fragmentation were quantified and expressed as apoptotic cells per field (mean ± SE, n =10). *P <0.01 versus respective control. (C) Effect of the gap junction inhibitor flufenamic acid (FFA) on MG132‐elicited loss of cell viability. Hepa‐1c1c7 cells were exposed to the indicated concentrations of MG132 in the presence or absence of 150 μm FFA for 12 h. Cellular viability was determined by formazan assay. The data are expressed as a percentage of the control (mean ± SE, n =4). *P <0.01 versus respective control. (D) Effect of FFA on Cx43 protein levels. 1c1c‐7 cells were exposed to the indicated concentrations of FFA for 12 h. The cellular protein was extracted and subjected to western blot analysis of Cx43. Expression of β‐actin is shown at the bottom as a loading control. (E) Effects of several different gap junction inhibitors on MG132‐elicited loss of cell viability. Hepa‐1c1c7 cells were exposed to 5 μg/mL MG132 in the presence or absence of 10 μm 18‐α glycyrrhetinic (α‐GA), 10 μm carbenoxolone (CBX), or 150 μm FFA for 12 h. Cellular viability was determined by formazan assay. The data are expressed as a percentage of the control (mean ± SE, n = 4). *P <0.01 versus MG132 alone.
Figure 4
Figure 4
Overexpression of connexin 43 (Cx43) in LLC‐PK1 cells with MG132‐induced cell injury. (A) LLC‐PK1 cells were transfected with a vector encoding Cx43 (Cx43‐EGFP) or GFP protein (pEGFP) and clones expressing a high level of Cx43 and GFP were selected. The expression of Cx43 and GFP before and after treatment with 1 μg/mL MG132 for 12 h is shown. Note the linear distribution of Cx43‐GFP at the region of cell‐to‐cell contact in untreated cells and the increased intensity and widespread cellular distribution of Cx43‐GFP after MG132 treatment. Magnification, ×400. (B) LLC‐PK1 cells expressing pEGFP or Cx43‐EGFP were exposed to 3 μg/mL MG132 for 12 h. The cellular protein was extracted and subjected to western blot analysis of Cx43. Expression of β‐actin is shown at the bottom as a loading control. (C,D) Effects of MG132 on cellular viability. LLC‐PK1 cells were exposed to (C) 1 μg/mL MG132 for the indicated times or (D) different concentrations of MG132 for 36 h. Cellular viability was determined by formazan assay. The data are expressed as a percentage of the control (mean ± SE, n =4). *P <0.01 versus the respective control. (E) Cells were treated with the indicated concentrations of MG132 for 28 h. The cellular proteins were extracted and subjected to western blot analysis of caspase‐3. The top band represents procaspase‐3 (M r 35 000) and the bottom band indicates its cleaved, mature form (M r 17 000). (F) Effects of the gap junction inhibitor flufenamic acid (FFA) on MG132‐elicited loss of cell viability in Cx43‐expressing LLC‐PK1 cells. Cx43‐EGFP LLC‐PK1 cells were exposed to the indicated concentrations of MG132 in the presence or absence of 150 μm FFA for 36 h. Cellular viability was determined by formazan assay. The data are expressed as a percentage of the control (mean ± SE, n =4). *P <0.01 versus the respective control. (G) Expression of mutated Cx43‐EGFP in LLC‐PK1 cells on MG132‐initiated loss of cell viability. LLC‐PK1 cells expressing EGFP, Cx43‐EGFP, or communication‐free mutated Cx43‐EGFP were exposed to the indicated concentrations of MG132 for 36 h. Cellular viability was determined by formazan assay. The data are expressed as a percentage of the control (mean ± SE, n =4).
Figure 5
Figure 5
Induction of endoplasmic reticulum (ER) stress by MG132 and influence of connexin 43 (Cx43) expression on ER stress‐elicited cell injury in LLC‐PK1 cells. (A,B) Induction of ER stress by MG132, thapsigargin (TG), and tunicamycin (TM). LLC‐PK1 cells were treated with (A) 1 μg/mL MG132 for the indicated time or (B) 100 nm TG or 5 μg/mL TM for 6 h. Cellular RNA was extracted and subjected to northern blot analysis of GRP78 and CHOP. Expression of GAPDH is shown at the bottom as a loading control. (C,D) Induction of cytotoxicity in LLC‐PK1 cells expressing different amounts of Cx43. Cells were exposed to the indicated concentrations of (C) TG or (D) TM for 36 and 60 h respectively. Cellular viability was determined by formazan assay. The data are expressed as a percentage of cellular survival normalized against the untreated control (mean ± SE, n =4). *P <0.01 versus the respective control. (E) Different activation of caspase‐3 by TG in LLC‐PK1 cells expressing different amounts of Cx43. Cells were treated with the indicated concentrations of TG for 24 h. The cellular proteins were extracted and subjected to western blot analysis for caspase‐3.
Figure 6
Figure 6
Influence of connexin 43 (Cx43) levels on cell response to MG132‐ and endoplasmic reticulum (ER) stress‐elicited cell injury. (A) Effects of MG132 on Cx43 protein levels in fibroblasts from Cx43+/+ and Cx43−/− littermates. Cx43+/+ and Cx43−/− fibroblasts were exposed to the indicated concentrations of MG132 for 12 h or left untreated. The expression of Cx43 was determined by western blot analysis. β‐Actin levels shown at the bottom of the blots indicate equal protein loading. (B,C) Cell viability of Cx43+/+ and Cx43−/− fibroblasts after MG132 treatment. (B) Cells were treated with 1 μg/mL MG132 for 36 h or left untreated (control). The living (green), early apoptotic (intense green), and dead cells (red) were identified by calcein AM/PI staining. (C) Fibroblasts were exposed to the indicated concentrations of MG132 for 36 h. Cell viability was evaluated by formazan assay. The data are expressed as percentage of the control (mean ± SE, n =4). *P <0.01 versus the respective control. (D) Induction of ER stress by MG132 in fibroblasts. Cx43+/+ and Cx43−/− fibroblasts were either exposed to 100 nm thapsigargin (TG) or 5 μg/mL tunicamycin (TM) for 12 h or left untreated. The expression of CHOP was determined by western blot analysis. (E) Cell viability in Cx43+/+ and Cx43−/− fibroblasts following ER stress as evaluated by calcein AM–propidium iodide (PI) double staining. Fibroblasts were treated with 5 μm TG for 36 h or left untreated. The living (green), early apoptotic (intense green), and dead cells (red; lower panel) were identified by calcein AM–PI staining. (F) Cell viability as evaluated by formazan assay. Cells were either exposed to 5 μm TG or 20 μg/mL TM for 48 h. The data are expressed as a percentage of the control (mean ± SE, n =4). *P <0.01 versus the respective control.

Similar articles

Cited by

References

    1. Daviet L, Colland F. Targeting ubiquitin specific proteases for drug discovery. Biochimie 2008; 90: 270–83. - PubMed
    1. Adams J. The development of proteasome inhibitors as anticancer drugs. Cancer Cell 2004; 5: 417–21. - PubMed
    1. Hideshima T, Richardson P, Chauhan D et al. The proteasome inhibitor PS‐341 inhibits growth, induces apoptosis, and overcomes drug resistance in human multiple myeloma cells. Cancer Res 2001; 61: 3071–6. - PubMed
    1. Conticello C, Adamo L, Giuffrida R et al. Proteasome inhibitors synergize with tumor necrosis factor‐related apoptosis‐induced ligand to induce anaplastic thyroid carcinoma cell death. J Clin Endocrinol Metab 2007; 92: 1938–42. - PubMed
    1. Cusack JC Jr, Liu R, Houston M et al. Enhanced chemosensitivity to CPT‐11 with proteasome inhibitor PS‐341: implications for systemic nuclear factor‐kappaB inhibition. Cancer Res 2001; 61: 3535–40. - PubMed

Publication types