

Semiquantitative assessment of the microdistribution of fluorescence-labeled monoclonal antibody in small peritoneal disseminations of ovarian cancer
- PMID: 19961490
- PMCID: PMC2848296
- DOI: 10.1111/j.1349-7006.2009.01423.x
Semiquantitative assessment of the microdistribution of fluorescence-labeled monoclonal antibody in small peritoneal disseminations of ovarian cancer
Abstract
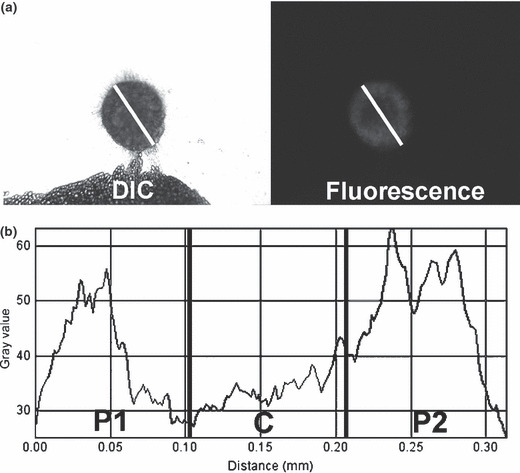
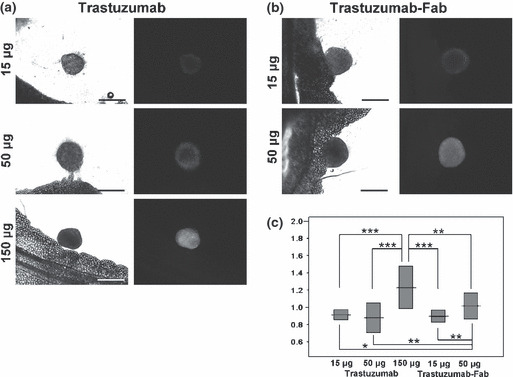
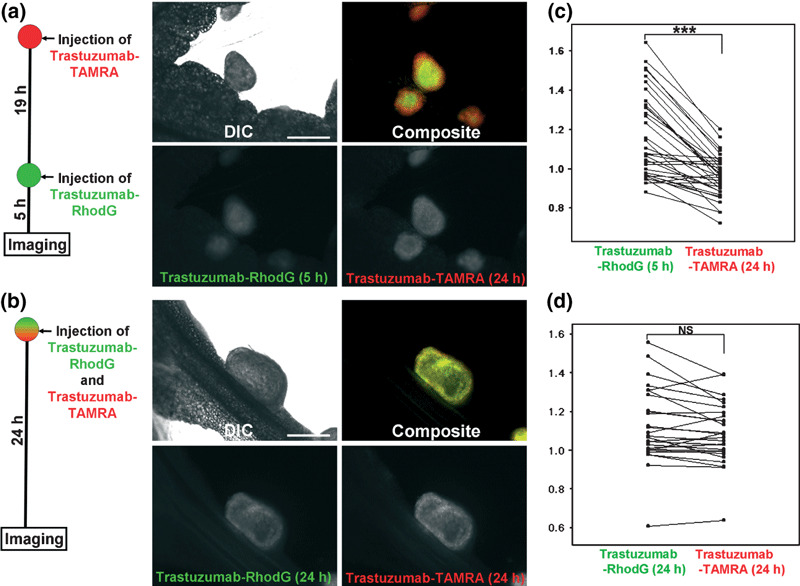
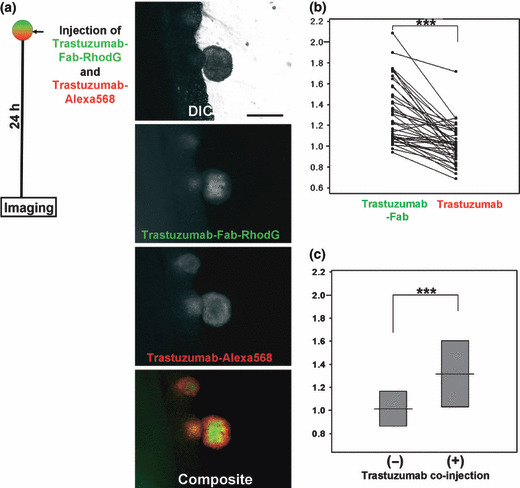
Uniform antibody microdistribution throughout tumor nodules is crucial for antibody-targeted therapy, because non-uniform microdistribution leads to suboptimal therapeutic effect, a commonly observed limitation of therapeutic antibodies. Herein, we evaluated the microdistribution of different doses of intraperitoneally injected fluorescence-labeled full-antibody trastuzumab (15, 50, and 150 microg) and its Fab fragment (trastuzumab-Fab: 15 and 50 microg) in a mouse model of ovarian cancer with peritoneal disseminated tumor. A semiquantitative approach (central/peripheral accumulation ratio; C/P ratio) was developed using in situ fluorescence microscopy. Furthermore, we compared the microdistribution of intact trastuzumab with a mixed injection of trastuzumab and trastuzumab-Fab or serial injections of trastuzumab using in situ multicolor fluorescence microscopy. Fluorescence images after the administration of 15 or 50 microg trastuzumab and 15 microg trastuzumab-Fab demonstrated antibody accumulation in the tumor periphery, whereas administration of 150 microg trastuzumab and 50 microg trastuzumab-Fab showed relatively uniform accumulation throughout the tumor nodule. Using serial injections (19-h interval) of trastuzumab-rhodamine green and carboxytetramethylrhodamine (TAMRA), it was observed that the latterly injected trastuzumab-TAMRA was distributed more centrally than trastuzumab-rhodamine green injected first, whereas no difference was observed in the control mixed-injection group. Moreover, the mixed injection of trastuzumab and trastuzumab-Fab showed that trastuzumab-Fab distributed more centrally than the same amount of co-injected trastuzumab. Our results suggest that the strategies of increasing dose and using Fab fragments can be used to achieve a uniform antibody distribution within peritoneal disseminated nodules after intraperitoneal injection. Furthermore, serial-injection and mixed-injection strategies can modify antibody microdistribution within tumors and have the potential for preferential delivery of anticancer drugs to either the tumor periphery or its center.
Figures
Similar articles
-
A kit to prepare (111)In-DTPA-trastuzumab (Herceptin) Fab fragments injection under GMP conditions for imaging or radioimmunoguided surgery of HER2-positive breast cancer.Nucl Med Biol. 2011 Jan;38(1):129-36. doi: 10.1016/j.nucmedbio.2010.06.010. Epub 2010 Sep 1. Nucl Med Biol. 2011. PMID: 21220136
-
The distribution of the therapeutic monoclonal antibodies cetuximab and trastuzumab within solid tumors.BMC Cancer. 2010 Jun 3;10:255. doi: 10.1186/1471-2407-10-255. BMC Cancer. 2010. PMID: 20525277 Free PMC article.
-
Comparisons of the intraocular tissue distribution, pharmacokinetics, and safety of 125I-labeled full-length and Fab antibodies in rhesus monkeys following intravitreal administration.Toxicol Pathol. 1999 Sep-Oct;27(5):536-44. doi: 10.1177/019262339902700507. Toxicol Pathol. 1999. PMID: 10528633
-
Imaging of HER2/neu expression in BT-474 human breast cancer xenografts in athymic mice using [(99m)Tc]-HYNIC-trastuzumab (Herceptin) Fab fragments.Nucl Med Commun. 2005 May;26(5):427-32. doi: 10.1097/00006231-200505000-00006. Nucl Med Commun. 2005. PMID: 15838425
-
Targeting HER2: a report on the in vitro and in vivo pre-clinical data supporting trastuzumab as a radioimmunoconjugate for clinical trials.MAbs. 2010 Sep-Oct;2(5):550-64. doi: 10.4161/mabs.2.5.13054. Epub 2010 Sep 1. MAbs. 2010. PMID: 20716957 Free PMC article.
Cited by
-
Cancer cell-selective in vivo near infrared photoimmunotherapy targeting specific membrane molecules.Nat Med. 2011 Nov 6;17(12):1685-91. doi: 10.1038/nm.2554. Nat Med. 2011. PMID: 22057348 Free PMC article.
-
In vivo real-time lymphatic draining using quantum-dot optical imaging in mice.Contrast Media Mol Imaging. 2013 Jan-Feb;8(1):96-100. doi: 10.1002/cmmi.1487. Contrast Media Mol Imaging. 2013. PMID: 23109398 Free PMC article.
-
Activatable organic near-infrared fluorescent probes based on a bacteriochlorin platform: synthesis and multicolor in vivo imaging with a single excitation.Bioconjug Chem. 2014 Feb 19;25(2):362-9. doi: 10.1021/bc4005238. Epub 2014 Feb 3. Bioconjug Chem. 2014. PMID: 24450401 Free PMC article.
-
Recent advances in optical cancer imaging of EGF receptors.Curr Med Chem. 2012;19(28):4759-66. doi: 10.2174/092986712803341584. Curr Med Chem. 2012. PMID: 22873662 Free PMC article. Review.
-
Molecular targeted photoimmunotherapy for HER2-positive human gastric cancer in combination with chemotherapy results in improved treatment outcomes through different cytotoxic mechanisms.BMC Cancer. 2016 Jan 25;16:37. doi: 10.1186/s12885-016-2072-0. BMC Cancer. 2016. PMID: 26810644 Free PMC article.
References
-
- Cheson BD, Leonard JP. Monoclonal antibody therapy for B‐cell non‐Hodgkin’s lymphoma. N Engl J Med 2008; 359: 613–26. - PubMed
-
- Boyiadzis M, Foon KA. Approved monoclonal antibodies for cancer therapy. Expert Opin Biol Ther 2008; 8: 1151–8. - PubMed
-
- Dalle S, Thieblemont C, Thomas L, Dumontet C. Monoclonal antibodies in clinical oncology. Anticancer Agents Med Chem 2008; 8: 523–32. - PubMed
-
- Mauri D, Polyzos NP, Salanti G, Pavlidis N, Ioannidis JP. Multiple‐treatments meta‐analysis of chemotherapy and targeted therapies in advanced breast cancer. J Natl Cancer Inst 2008; 100: 1780–91. - PubMed
-
- Tassev DV, Cheung NK. Monoclonal antibody therapies for solid tumors. Expert Opin Biol Ther 2009; 9: 341–53. - PubMed
Publication types
MeSH terms
Substances
Grants and funding
LinkOut - more resources
Full Text Sources
Medical
Miscellaneous
