

Haemoglobin interference and increased sensitivity of fluorimetric assays for quantification of low-parasitaemia Plasmodium infected erythrocytes
- PMID: 19961586
- PMCID: PMC2794876
- DOI: 10.1186/1475-2875-8-279
Haemoglobin interference and increased sensitivity of fluorimetric assays for quantification of low-parasitaemia Plasmodium infected erythrocytes
Abstract
Background: Improvements on malarial diagnostic methods are currently needed for the correct detection in low-density Plasmodium falciparum infections. Microfluorimetric DNA-based assays have been previously used for evaluation of anti-malarial drug efficacy on Plasmodium infected erythrocytes. Several factors affecting the sensitivity of these methods have been evaluated, and tested for the detection and quantification of the parasite in low parasitaemia conditions.
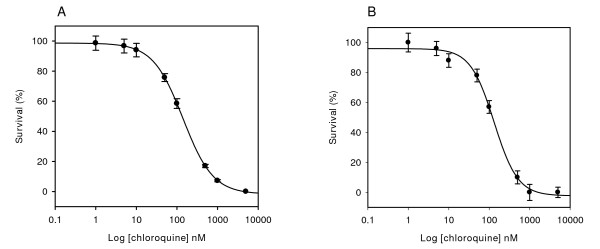
Methods: Parasitaemia was assessed by measuring SYBRGreen I (SGI) and PicoGreen (PG) fluorescence of P. falciparum Dd2 cultures on human red blood cells. Different modifications of standard methods were tested to improve the detection sensitivity. Calculation of IC50 for chloroquine was used to validate the method.
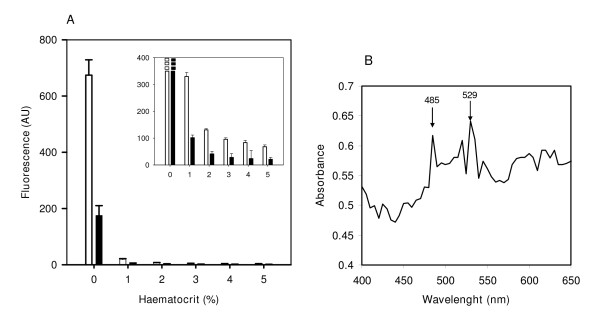
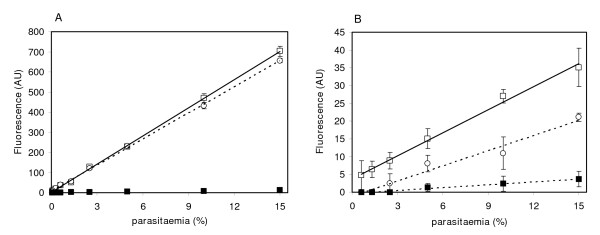
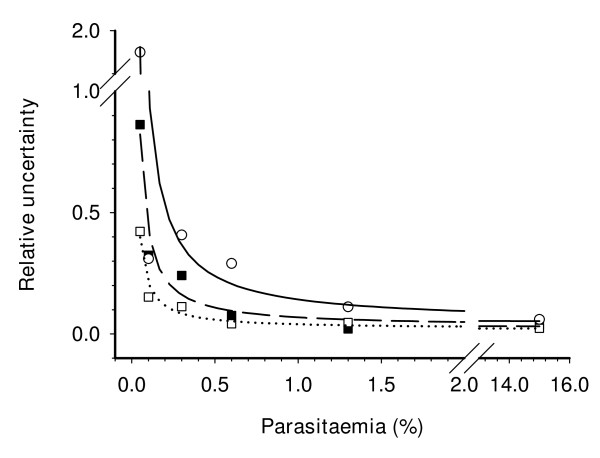
Results: Removal of haemoglobin from infected red-blood cells culture (IRBC) increased considerably the fluorescent signal obtained from both SGI and PG. Detergents used for cell lysis also showed to have an effect on the fluorescent signal. Upon depletion of haemoglobin and detergents the fluorescence emission of SGI and PG increased, respectively, 10- and 60-fold, extending notably the dynamic range of the assay. Under these conditions, a 20-fold higher PG vs. SGI fluorescent signal was observed. The estimated limits of detection and quantification for the PG haemoglobin/detergent-depleted method were 0.2% and 0.7% parasitaemia, respectively, which allow the detection of ~10 parasites per microliter. The method was validated on whole blood-infected samples, displaying similar results as those obtained using IRBC. Removal of white-blood cells prior to the assay allowed to increase the accuracy of the measurement, by reducing the relative uncertainty at the limit of detection from 0.5 to 0.1.
Conclusion: The use of PG microassays on detergent-free, haemoglobin-depleted samples appears as the best choice both for the detection of Plasmodium in low-density infections and anti-malarial drugs tests.
Figures
Similar articles
-
A novel DNA-based microfluorimetric method to evaluate antimalarial drug activity.Am J Trop Med Hyg. 2004 Feb;70(2):119-24. Am J Trop Med Hyg. 2004. PMID: 14993620
-
Direct comparison of the histidine-rich protein-2 enzyme-linked immunosorbent assay (HRP-2 ELISA) and malaria SYBR green I fluorescence (MSF) drug sensitivity tests in Plasmodium falciparum reference clones and fresh ex vivo field isolates from Cambodia.Malar J. 2013 Jul 12;12:239. doi: 10.1186/1475-2875-12-239. Malar J. 2013. PMID: 23849006 Free PMC article.
-
An improved SYBR Green-1-based fluorescence method for the routine monitoring of Plasmodium falciparum resistance to anti-malarial drugs.Malar J. 2015 Dec 1;14:481. doi: 10.1186/s12936-015-1011-x. Malar J. 2015. PMID: 26625907 Free PMC article.
-
Assessment of the Worldwide Antimalarial Resistance Network Standardized Procedure for In Vitro Malaria Drug Sensitivity Testing Using SYBR Green Assay for Field Samples with Various Initial Parasitemia Levels.Antimicrob Agents Chemother. 2016 Mar 25;60(4):2417-24. doi: 10.1128/AAC.00527-15. Print 2016 Apr. Antimicrob Agents Chemother. 2016. PMID: 26856829 Free PMC article.
-
Progress and challenges in the use of fluorescence-based flow cytometric assays for anti-malarial drug susceptibility tests.Malar J. 2021 Jan 21;20(1):57. doi: 10.1186/s12936-021-03591-8. Malar J. 2021. PMID: 33478496 Free PMC article. Review.
Cited by
-
Chemical Genomic Profiling Unveils the in Vitro and in Vivo Antiplasmodial Mechanism of Açaí (Euterpe oleracea Mart.) Polyphenols.ACS Omega. 2019 Sep 13;4(13):15628-15635. doi: 10.1021/acsomega.9b02127. eCollection 2019 Sep 24. ACS Omega. 2019. PMID: 31572864 Free PMC article.
-
Parasitostatic effect of maslinic acid. I. Growth arrest of Plasmodium falciparum intraerythrocytic stages.Malar J. 2011 Apr 10;10:82. doi: 10.1186/1475-2875-10-82. Malar J. 2011. PMID: 21477369 Free PMC article.
-
A centrifugal microfluidic cross-flow filtration platform to separate serum from whole blood for the detection of amphiphilic biomarkers.Sci Rep. 2021 Mar 5;11(1):5287. doi: 10.1038/s41598-021-84353-z. Sci Rep. 2021. PMID: 33674653 Free PMC article.
-
Squalestatin is an inhibitor of carotenoid biosynthesis in Plasmodium falciparum.Antimicrob Agents Chemother. 2015;59(6):3180-8. doi: 10.1128/AAC.04500-14. Epub 2015 Mar 16. Antimicrob Agents Chemother. 2015. PMID: 25779575 Free PMC article.
-
Intraerythrocytic stages of Plasmodium falciparum biosynthesize menaquinone.FEBS Lett. 2010 Dec 1;584(23):4761-4768. doi: 10.1016/j.febslet.2010.10.055. Epub 2010 Oct 29. FEBS Lett. 2010. PMID: 21036171 Free PMC article.
References
-
- Babiker HA, Abdel-Muhsin ABA, Ranford-Cartwright LC, Satti G, Walliker D. Characteristics of Plasmodium falciparum parasites that survive the lengthy dry season in eastern Sudan where malaria transmission is markedly seasonal. Am J Trop Med Hyg. 1998;59:582–590. - PubMed
-
- Abdel-Wahab A, Abdel-Muhsin AMA, Ali E, Suleiman S, Ahmed S, Walliker D, Babiker HA. 12th Meeting of the British-Society-for-Parasitology-Malaria: Sep 10-12 2001. Leeds, England: Univ Chicago Press; 2001. Dynamics of gametocytes among Plasmodium falciparum clones in natural infections in an area of highly seasonal transmission; pp. 1838–1842. - PubMed
-
- Mayor A, Serra-Casas E, Bardaji A, Sanz S, Puyol L, Cistero P, Sigauque B, Mandomando I, Aponte JJ, Alonso PL, Menéndez C. Sub-microscopic infections and long-term recrudescence of Plasmodium falciparum in Mozambican pregnant women. Malar J. 2009;8:10. doi: 10.1186/1475-2875-8-9. - DOI - PMC - PubMed
Publication types
MeSH terms
Substances
LinkOut - more resources
Full Text Sources
