. 2009 Dec 4:3:113.
doi: 10.1186/1752-0509-3-113.

Impact of environmental inputs on reverse-engineering approach to network structures

Affiliations

Impact of environmental inputs on reverse-engineering approach to network structures

Jianhua Wu et al. BMC Syst Biol. .

Abstract

Background: Uncovering complex network structures from a biological system is one of the main topic in system biology. The network structures can be inferred by the dynamical Bayesian network or Granger causality, but neither techniques have seriously taken into account the impact of environmental inputs.

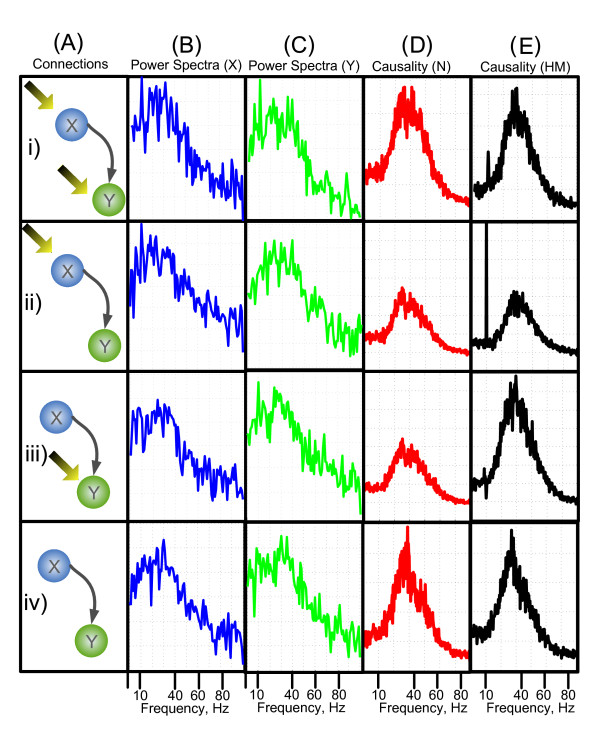
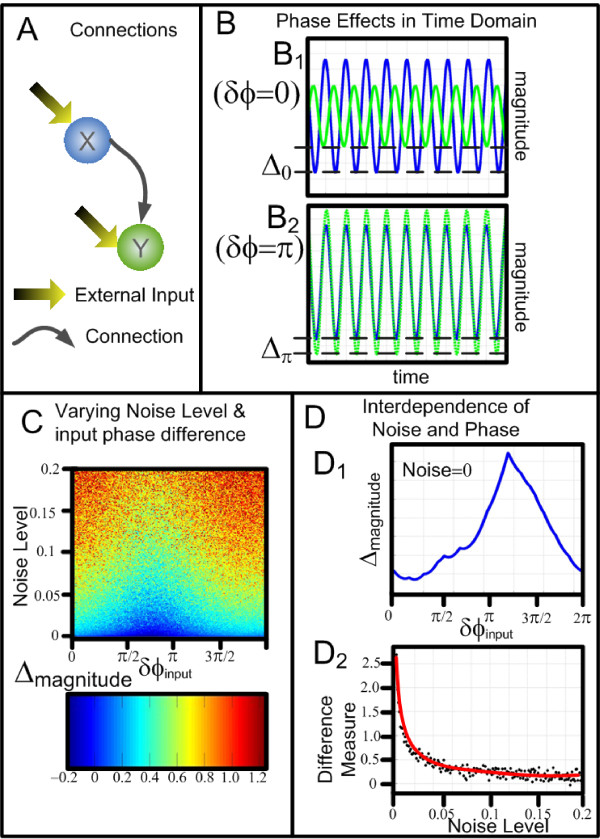
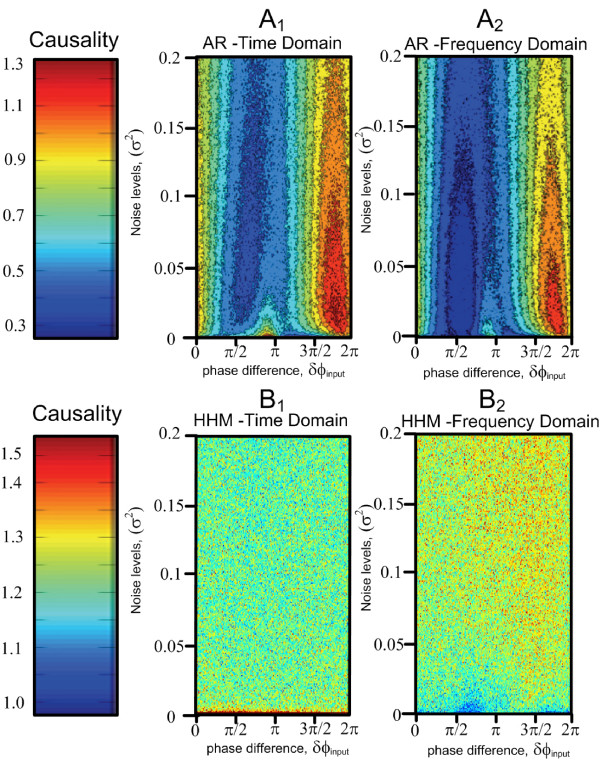
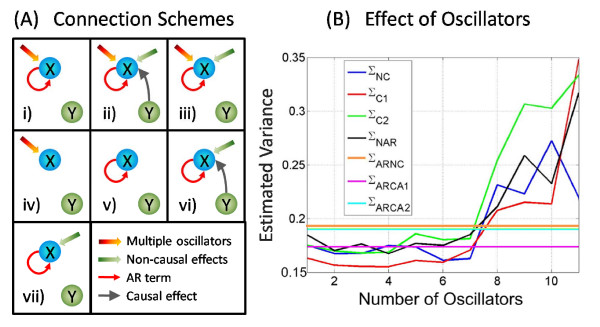
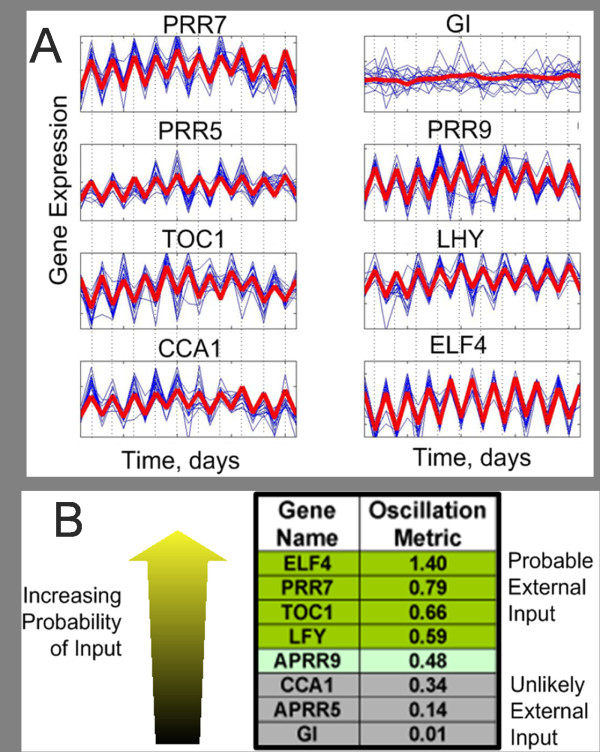
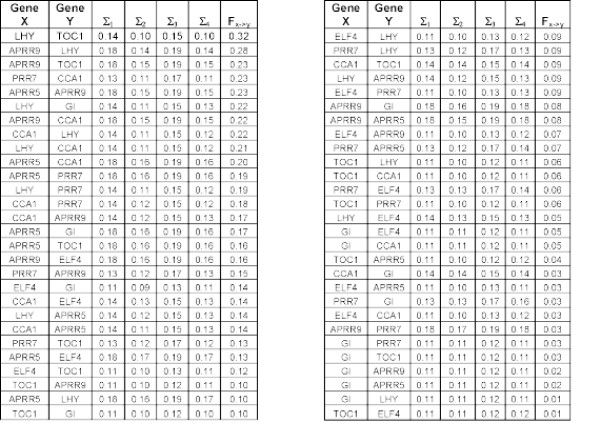
Results: With considerations of natural rhythmic dynamics of biological data, we propose a system biology approach to reveal the impact of environmental inputs on network structures. We first represent the environmental inputs by a harmonic oscillator and combine them with Granger causality to identify environmental inputs and then uncover the causal network structures. We also generalize it to multiple harmonic oscillators to represent various exogenous influences. This system approach is extensively tested with toy models and successfully applied to a real biological network of microarray data of the flowering genes of the model plant Arabidopsis Thaliana. The aim is to identify those genes that are directly affected by the presence of the sunlight and uncover the interactive network structures associating with flowering metabolism.

Conclusion: We demonstrate that environmental inputs are crucial for correctly inferring network structures. Harmonic causal method is proved to be a powerful technique to detect environment inputs and uncover network structures, especially when the biological data exhibit periodic oscillations.


Figures

Figure 1
Figure 1
Validation of the hidden harmonic methodology. Four different model configurations are considered. In each configuration node X has a causal influence of node Y. In (i) both of the nodes have environmental inputs, in (ii) and (iii) the simulation has just node X or node Y have an external input, in (iv) neither X or Y have external inputs. (A) shows the connection configurations. In (B) and (C) the power spectra of each configuration are shown in frequency domain, node X is shown in blue, node Y is shown in green. (D) and (E) show the causality spectra from X to Y, fXY, the causality calculated using the normal Granger AR method is shown in column (D), the harmonic causal method is shown in column (E).
Figure 2
Figure 2
The Effects of Varying Input Phase. A): shows the model configuration where X has a causal influence upon Y and there is no feedback. Both X an Y have an external, environmental oscillatory input. B): shows approximately 1 sec of simulated time domain plots the blue trace is Xt, the green trace is Yt. In B1 ϕx = ϕy and in B2 δϕ = ϕx- ϕy = π, in both B1 and B2 the X trace is identical, yet the trace of Y is shown to be greatly changed simply by altering the phase difference. The difference in the magnitude is denoted by Δ. As the inherent noise will mask the effect of the phase differences, C) shows the effect on Δ by varying both input noise and δϕ. D1 shows how this Δ changes by varying δϕ in the absence of noise. D2 shows how the effect of noise in the system lessens the effect of the phase differences.
Figure 3
Figure 3
Each colourmap shows the causality calculated whilst varying noise and input phase difference. A1 shows the causality calculated using the AR method in the time domain, A2 shows the causality calculated by integration of the AR method frequency domain causality. B1 shows the causality calculated using the harmonic method in the time domain, B2 shows the causality calculated by integration of the harmonic method frequency domain causality.
Figure 4
Figure 4
Investigation of the interrelation between the phase difference of input and output signals and noise level. A): a colourmap plot of the phase difference of output signal against the phase difference of input signal and noise level. The phase difference of output signal is almost uniformly distributed for varying noise level and the phase difference of the input signal. B) and C) demonstrate the averaged phase difference of the output signal against noise level and the phase difference of the input signal, respectively.
Figure 5
Figure 5
Schematic connection plots and estimated variance for different number of oscillators. A): Seven connection schemes for causal and non-causal influence when there are or not harmonic oscillators. B): Using a simple small sparsely connected network consisting 5 nodes. The number of oscillators was increased and various fitting algorithms are applied.
Figure 6
Figure 6
Time domain traces of gene expression of eight genes under scrutiny and possible environment input. A): The time domain plots, in blue is the 16 repetitions of the experimental data and in red is the parameterized fitted data (Causal harmonic fitting). With the exception of the gene GI, each of the gene exhibits high periodicity and high levels of repeatability. B): The 8 genes and the oscillation metric, those with a larger metric are more likely to contain an external oscillatory input.
Figure 7
Figure 7
The errors associated with each of the gene pairs for each of the four candidate models, the causality, FXY is calculated either with formula image or formula image depending upon whether the gene has an external input.
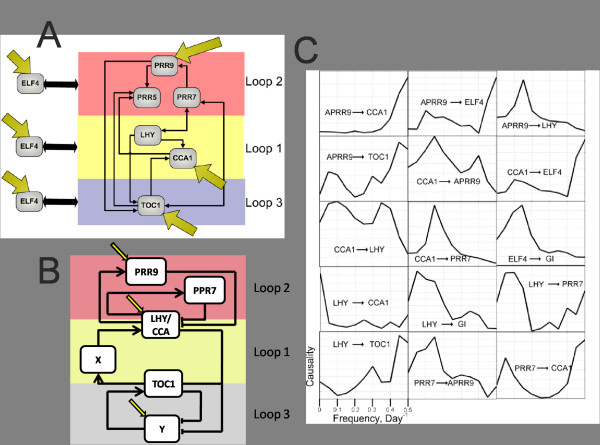
Figure 8
Figure 8
A): Candidate gene network calculated using the both the harmonic and non-harmonic schemes. B): reproduced Ueda's candidate model [32,33]. C): Causality spectra for 15 connections inferred from the network.

Similar articles

References

    1. Alon U. Biological networks: the tinkerer as an engineer. Science. 2003;301(5641):1866–1867. doi: 10.1126/science.1089072. - DOI - PubMed
    1. Gardner TS, di Bernardo D, Lorenz D, Collins JJ. Inferring genetic networks and identifying compound mode of action via expression profiling. Science. 2003;301(5629):102–105. doi: 10.1126/science.1081900. - DOI - PubMed
    1. Lopes da Silva F, Pijn JP, Boeijinga P. Interdependence of eeg signals: linear vs. nonlinear associations and the significance of time delays and phase shifts. Brain Topogr. 1989;2(1-2):9–18. doi: 10.1007/BF01128839. - DOI - PubMed
    1. Kocsis B, Bragin A, Buzsaki G. Interdependence of multiple theta generators in the hippocampus: a partial coherence analysis. J Neurosci. 1999;19(14):6200–6212. - PMC - PubMed
    1. Albo Z, Di Prisco GV, Chen YH, Rangarajan G, Truccolo W, Feng JF, Vertes RP, Ding MZ. Is partial coherence a viable technique for identifying generators of neural oscillations? Biological Cybernetics. 2004;90(5):318–326. doi: 10.1007/s00422-004-0475-5. - DOI - PubMed

Publication types

MeSH terms

LinkOut - more resources