. 2009 Dec 4:10:127.
doi: 10.1186/1471-2350-10-127.

Power of multifactor dimensionality reduction and penalized logistic regression for detecting gene-gene interaction in a case-control study

Affiliations

Power of multifactor dimensionality reduction and penalized logistic regression for detecting gene-gene interaction in a case-control study

Hua He et al. BMC Med Genet. .

Abstract

Background: There is a growing awareness that interaction between multiple genes play an important role in the risk of common, complex multi-factorial diseases. Many common diseases are affected by certain genotype combinations (associated with some genes and their interactions). The identification and characterization of these susceptibility genes and gene-gene interaction have been limited by small sample size and large number of potential interactions between genes. Several methods have been proposed to detect gene-gene interaction in a case control study. The penalized logistic regression (PLR), a variant of logistic regression with L2 regularization, is a parametric approach to detect gene-gene interaction. On the other hand, the Multifactor Dimensionality Reduction (MDR) is a nonparametric and genetic model-free approach to detect genotype combinations associated with disease risk.

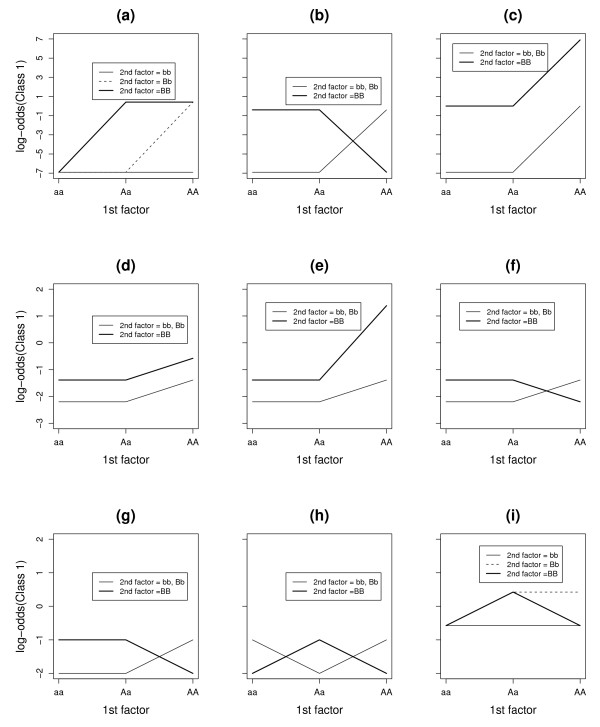
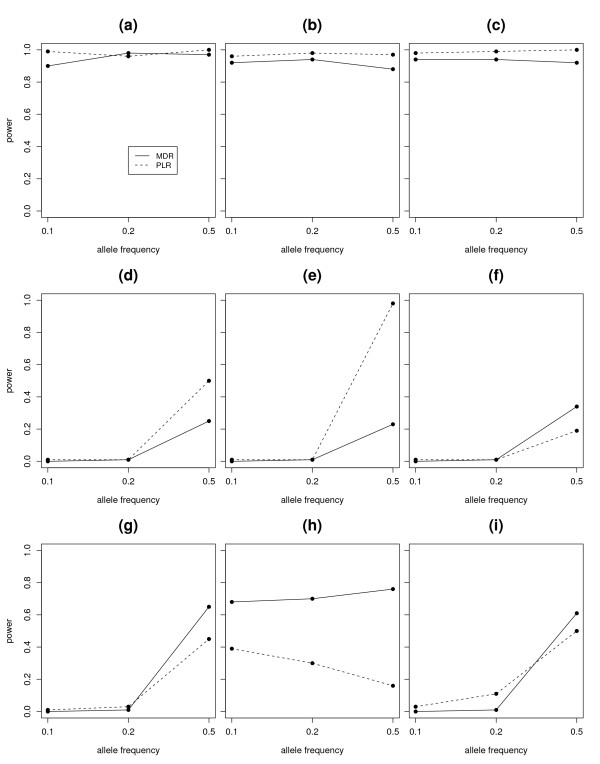
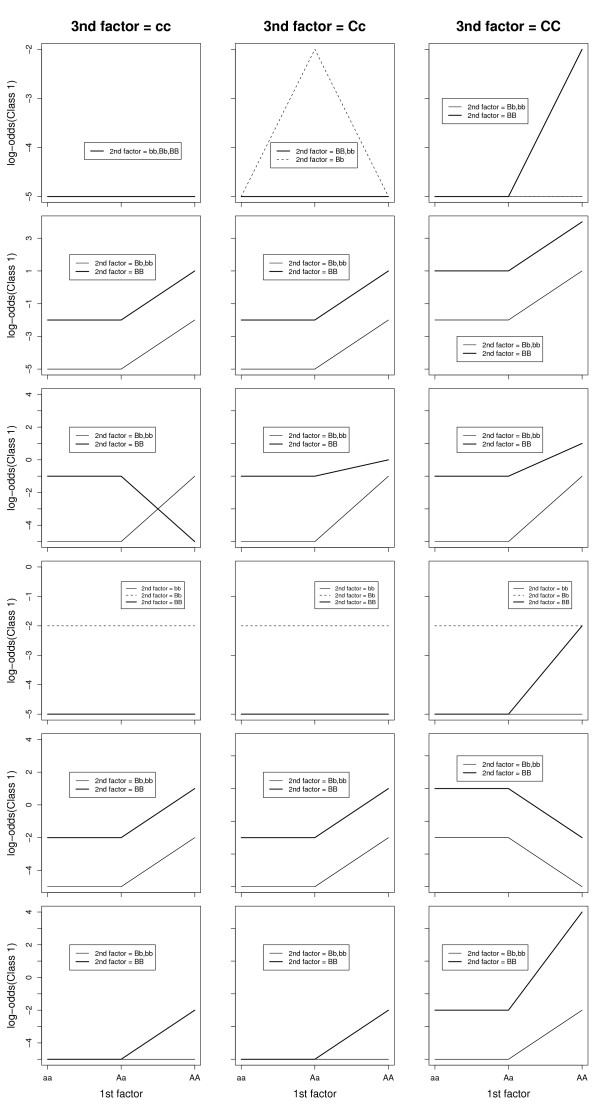
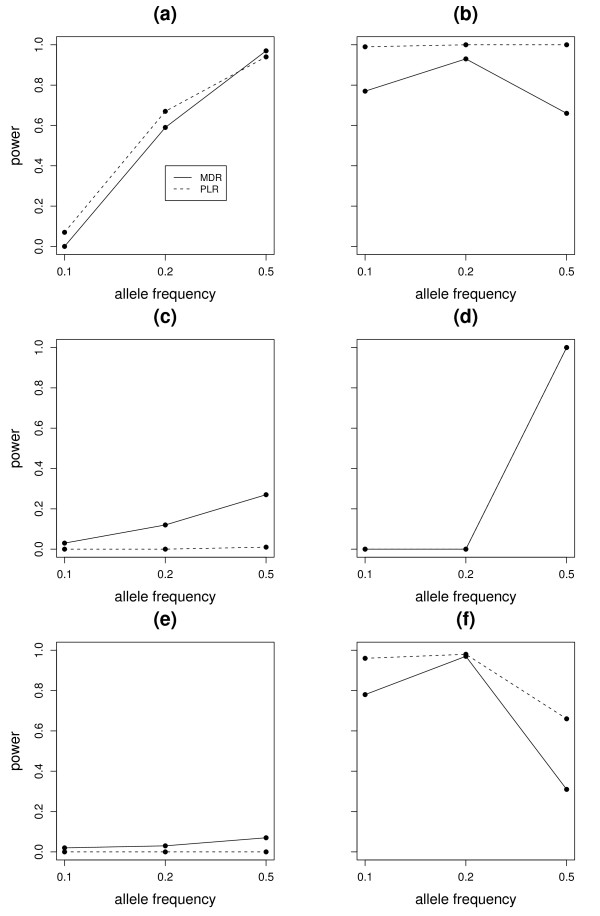
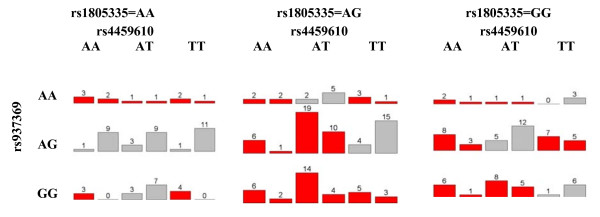
Methods: We compared the power of MDR and PLR for detecting two-way and three-way interactions in a case-control study through extensive simulations. We generated several interaction models with different magnitudes of interaction effect. For each model, we simulated 100 datasets, each with 200 cases and 200 controls and 20 SNPs. We considered a wide variety of models such as models with just main effects, models with only interaction effects or models with both main and interaction effects. We also compared the performance of MDR and PLR to detect gene-gene interaction associated with acute rejection(AR) in kidney transplant patients.

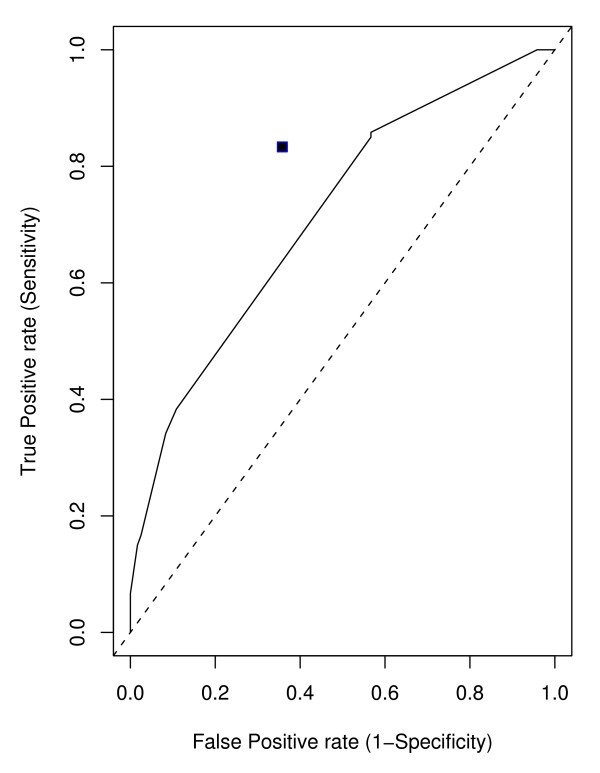
Results: In this paper, we have studied the power of MDR and PLR for detecting gene-gene interaction in a case-control study through extensive simulation. We have compared their performances for different two-way and three-way interaction models. We have studied the effect of different allele frequencies on these methods. We have also implemented their performance on a real dataset. As expected, none of these methods were consistently better for all data scenarios, but, generally MDR outperformed PLR for more complex models. The ROC analysis on the real dataset suggests that MDR outperforms PLR in detecting gene-gene interaction on the real dataset.

Conclusion: As one might expect, the relative success of each method is context dependent. This study demonstrates the strengths and weaknesses of the methods to detect gene-gene interaction.


Figures

Figure 1
Figure 1
The pattern of log-odds for 2-way interaction models. The patterns of log-odds for class1(affected) for different levels of the two SNPs (SNP1 and SNP2) under nine different models with 2-way interactions. The subfigures (a), (b), (c), (d), (e), (f), (g), (h), (i) represent Model 1, Model 2, Model 3, Model 4, Model 5, Model 6, Model 7, Model 8 and Model 9 (Table 1) respectively.
Figure 2
Figure 2
Power Comparison for two-way interactions. Figure shows the power of MDR and PLR for detection of interaction under 9 different 2-way interaction models. Eeach plot represents the power of MDR and PLR under different allele frequencies of the associated SNPs. The power of MDR was presented with a solid line and the power of PLR was presented with a dashed line in each figure. The subfigures (a), (b), (c), (d), (e), (f), (g), (h), (i) represent the power plots for Model 1, Model 2, Model 3, Model 4, Model 5, Model 6, Model 7, Model 8 and Model 9 (Table 1) respectively.
Figure 3
Figure 3
The pattern of log-odds for 3-way interaction models. The patterns of log-odds for class1(affected) for different levels of the three SNPs (SNP1, SNP2 and SNP3) under six different models with 3-way interactions. SNP1 has three levels AA, Aa, aa; SNP2 has three different levels BB, Bb, bb and SNP3 has three levels CC, Cc, cc. Each row presents a specific interaction model. The rows 1, 2, 3, 4, 5 and 6 list the interaction models Model 1, Model 2, Model 3, Model 4, Model 5 and Model 6 (Table 3) respectively.
Figure 4
Figure 4
Power for 3-way interactions. Figure shows the power of MDR and PLR for detection of interaction under 6 different 3-way interaction models. Eeach plot represents the power of MDR and PLR under different allele frequencies of the associated SNPs. The power of MDR was presented with a solid line and the power of PLR was presented with a dashed line in each figure. The subfigures (a), (b), (c), (d), (e), (f) represent the power plots for Model 1, Model 2, Model 3, Model 4, Model 5, Model 6 (Table 3) respectively.
Figure 5
Figure 5
ROC Curve. Receiver operating characteristic (ROC) curves for penalized logistic regression. The value for MDR is represented by a solid square in the plot.
Figure 6
Figure 6
The case-control distribution for MDR. The case-control distribution of the finally selected 3-way interaction model for MDR. If a person falls in the red cell, MDR classifies him as a case(AR), otherwise a control.

References

    1. Glazier AM, Nadeau JH, Aitman TJ. Finding Genes That underlie Complex Traits. Science. 2002;298:2345–2349. doi: 10.1126/science.1076641. - DOI - PubMed
    1. Dreyer SD, Zhou G, Baldini A, Winterpacht A, Zabel B, Cole W, Johnson R, Lee B. Mutations in LMX1B cause abnormal skeletal patterning and renal dysplasia in nail patella syndrome. Nature Genetics. 1998;19:47–50. doi: 10.1038/ng0598-47. - DOI - PubMed
    1. Kerem B, Rommens J, Buchanan J, Markiewicz D, Cox T, Chakravarti A, Buchwald M, Tsui L. Identification of the Cystic-Fibrosis Gene - Genetic Analysis. Science. 1989;245:1073–1080. doi: 10.1126/science.2570460. - DOI - PubMed
    1. Hollander WF. Epistasis and hypostasis. J Hered. 1955;46:222–225.
    1. Phillips PC. The language of gene interaction. Genetics. 1998;149:1167–1171. - PMC - PubMed

Publication types